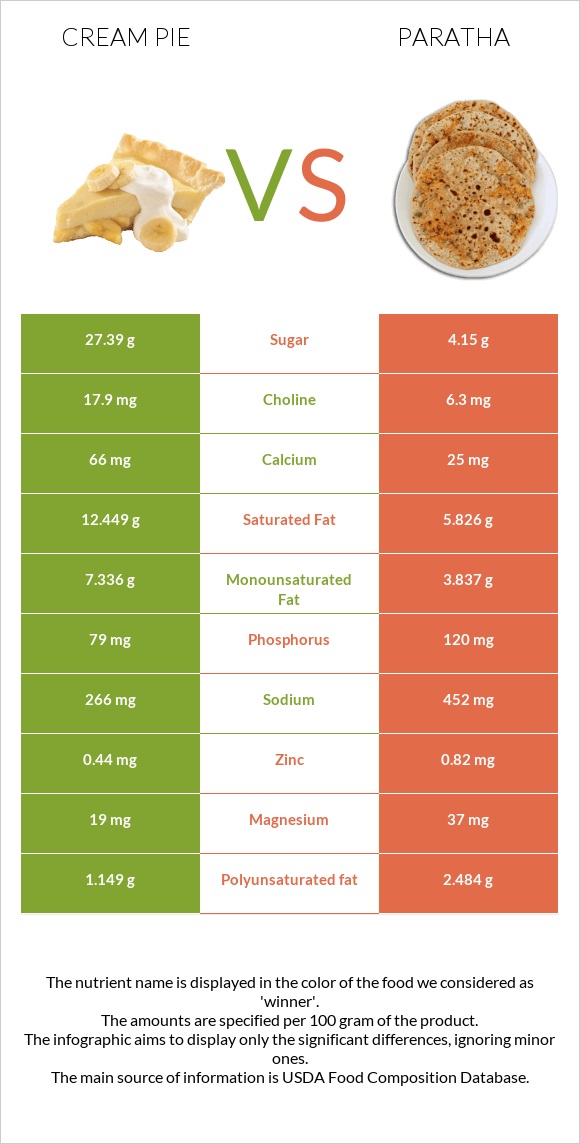
What are the main differences between cream pie and paratha? Cream pie is richer in vitamin K, yet paratha is richer in manganese, fiber, vitamin B3, and phosphorus. Paratha's daily need coverage for manganese is 39% higher. Cream pie has 3 times more vitamin K than paratha. Cream pie has 9.5µg of vitamin K, while paratha has 3.4µg. Paratha contains less saturated fat. We used Pie, chocolate creme, commercially prepared and Bread, paratha, whole wheat, commercially prepared, frozen types in this comparison.
Infographic
Mineral Comparison
Mineral comparison score is based on the number of minerals by which one or the other food is richer. The "coverage" charts below show how much of the daily needs can be covered by 300 grams of the food.
3
100 g
300 g
1 oz - 28.35g 1 piece (1/4 of 6" pie) - 99g 1 piece (1/6 of 8" pie) - 113g 1 serving .167 pie - 120g
Magnesium
Magnesium
Calcium
Calcium
Potassium
Potassium
Iron
Iron
Copper
Copper
Zinc
Zinc
Phosphorus
Phosphorus
Sodium
Sodium
Manganese
Manganese
Selenium
Selenium
14%
20%
14%
56%
39%
12%
34%
35%
21%
33%
6
100 g
300 g
1 piece - 79g
Magnesium
Magnesium
Calcium
Calcium
Potassium
Potassium
Iron
Iron
Copper
Copper
Zinc
Zinc
Phosphorus
Phosphorus
Sodium
Sodium
Manganese
Manganese
Selenium
Selenium
26%
7.5%
12%
60%
49%
22%
51%
59%
137%
39%
Vitamin Comparison
Vitamin comparison score is based on the number of vitamins by which one or the other food is richer. The "coverage" charts below show how much of the daily needs can be covered by 300 grams of the food.
6
100 g
300 g
1 oz - 28.35g 1 piece (1/4 of 6" pie) - 99g 1 piece (1/6 of 8" pie) - 113g 1 serving .167 pie - 120g
Vitamin C
Vit. C
Vitamin D
Vit. D
Vitamin A
Vit. A
Vitamin E
Vit. E
Vitamin B1
Vit. B1
Vitamin B2
Vit. B2
Vitamin B3
Vit. B3
Vitamin B5
Vit. B5
Vitamin B6
Vit. B6
Vitamin B12
Vit. B12
Vitamin K
Vit. K
Folate
Folate
0%
1.5%
15%
22%
22%
32%
11%
14%
4.6%
15%
24%
14%
5
100 g
300 g
1 piece - 79g
Vitamin C
Vit. C
Vitamin D
Vit. D
Vitamin A
Vit. A
Vitamin E
Vit. E
Vitamin B1
Vit. B1
Vitamin B2
Vit. B2
Vitamin B3
Vit. B3
Vitamin B5
Vit. B5
Vitamin B6
Vit. B6
Vitamin B12
Vit. B12
Vitamin K
Vit. K
Folate
Folate
0%
0%
0.67%
27%
28%
18%
34%
28%
18%
0%
8.5%
7.5%
All nutrients comparison - raw data values
Nutrient
DV% diff.
Manganese
0.161mg
1.054mg
39%
Fiber
0.8g
9.6g
35%
Saturated fat
12.449g
5.826g
30%
Fats
22.41g
13.2g
14%
Starch
31.5g
13%
Monounsaturated fat
7.336g
3.837g
9%
Polyunsaturated fat
1.149g
2.484g
9%
Sodium
266mg
452mg
8%
Vitamin B3
0.605mg
1.83mg
8%
Phosphorus
79mg
120mg
6%
Vitamin A
46µg
2µg
5%
Vitamin B2
0.14mg
0.076mg
5%
Vitamin B5
0.232mg
0.465mg
5%
Vitamin B6
0.02mg
0.08mg
5%
Vitamin B12
0.12µg
0µg
5%
Vitamin K
9.5µg
3.4µg
5%
Protein
4.15g
6.36g
4%
Cholesterol
12mg
1mg
4%
Magnesium
19mg
37mg
4%
Calcium
66mg
25mg
4%
Copper
0.118mg
0.146mg
3%
Zinc
0.44mg
0.82mg
3%
Carbs
38.44g
45.35g
2%
Iron
1.49mg
1.61mg
2%
Vitamin E
1.09mg
1.35mg
2%
Selenium
6µg
7.1µg
2%
Vitamin B1
0.087mg
0.11mg
2%
Folate
19µg
10µg
2%
Choline
17.9mg
6.3mg
2%
Calories
353kcal
326kcal
1%
Vitamin D
0.1µg
0µg
1%
Potassium
161mg
139mg
1%
Protein per 100 calories
1.2g
2g
N/A
Calories per 10 g protein
851kcal
513kcal
N/A
Weight per 100 calories
28g
31g
N/A
Unsaturated / Saturated Fat ratio
0.68
1.1
N/A
Net carbs
37.64g
35.75g
N/A
Vitamin D*
3 IU
0 IU
0%
Sugar
27.39g
4.15g
N/A
Trans fat
2.49g
0.034g
N/A
Fructose
0.35g
0%
Omega-3 - EPA
0.001g
0g
N/A
Omega-3 - ALA
0.064g
N/A
Omega-3 - Eicosatrienoic acid
0.003g
N/A
Omega-6 - Gamma-linoleic acid
0.006g
N/A
Omega-6 - Eicosadienoic acid
0g
0.002g
N/A
Omega-6 - Linoleic acid
2.386g
N/A
Macronutrient Comparison
Macronutrient breakdown side-by-side comparison
2
4%
22%
38%
34%
Protein:
4.15 g
Fats:
22.41 g
Carbs:
38.44 g
Water:
33.92 g
Other:
1.08 g
3
6%
13%
45%
34%
Protein:
6.36 g
Fats:
13.2 g
Carbs:
45.35 g
Water:
33.5 g
Other:
1.59 g
Contains
more
Fats Fats
+69.8%
Contains
more
Protein Protein
+53.3%
Contains
more
Carbs Carbs
+18%
Contains
more
Other Other
+47.2%
Fat Type Comparison
Fat type breakdown side-by-side comparison
1
59%
35%
5%
Saturated fat:
Sat. Fat
12.449 g
Monounsaturated fat:
Mono. Fat
7.336 g
Polyunsaturated fat:
Poly. Fat
1.149 g
2
48%
32%
20%
Saturated fat:
Sat. Fat
5.826 g
Monounsaturated fat:
Mono. Fat
3.837 g
Polyunsaturated fat:
Poly. Fat
2.484 g
Contains
more
Mono. Fat Monounsaturated fat
+91.2%
Contains
less
Sat. Fat Saturated fat
-53.2%
Contains
more
Poly. Fat Polyunsaturated fat
+116.2%