Danish pastry nutrition: calories, carbs, GI, protein, fiber, fats

Carbohydrates in Danish pastry
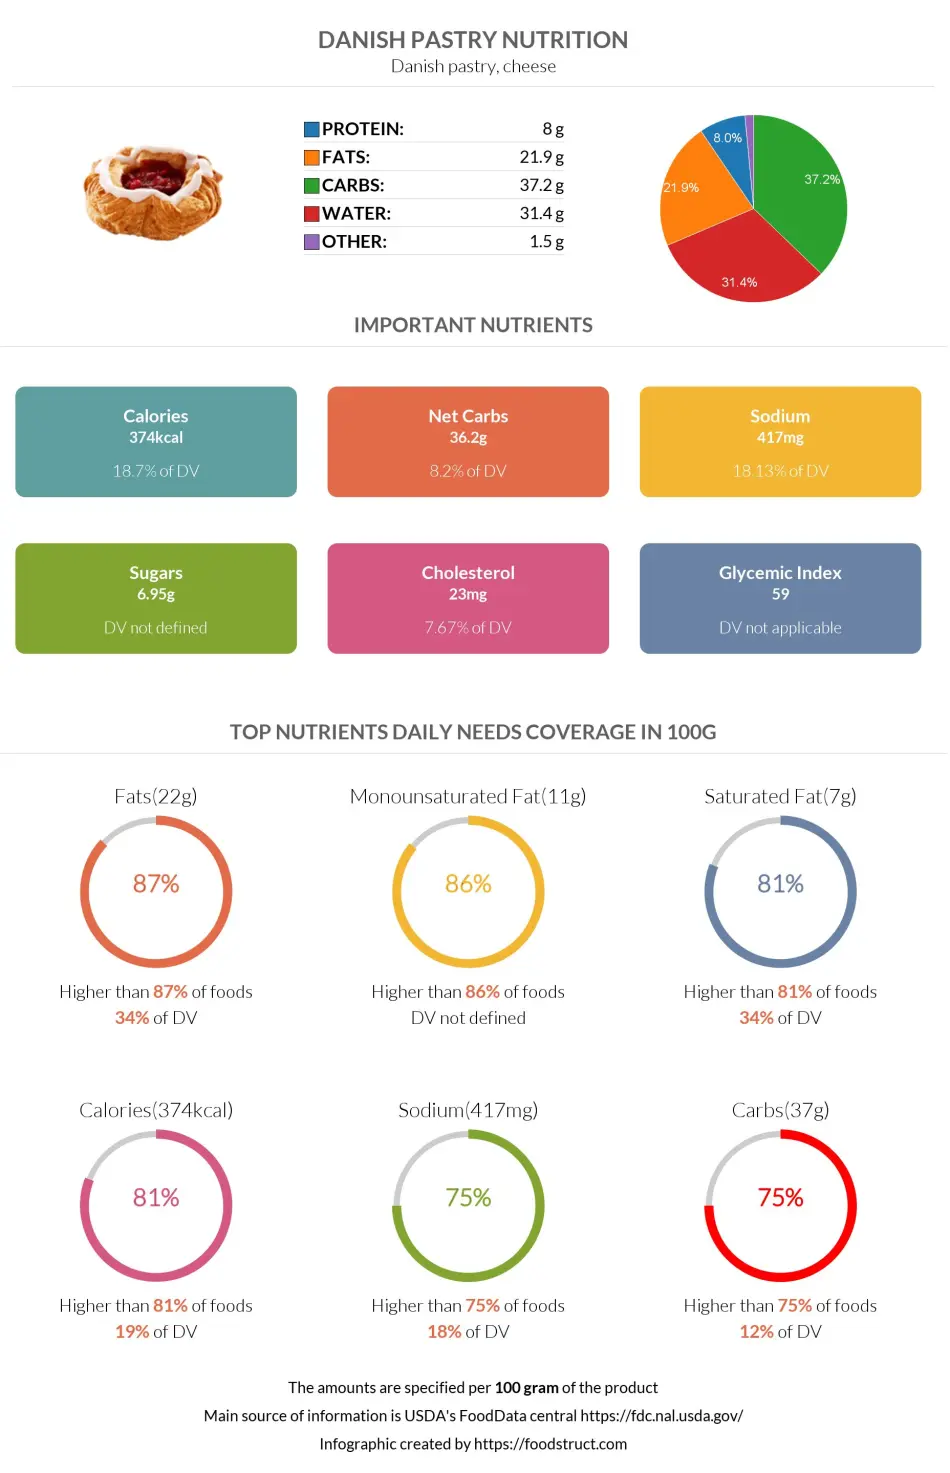
Danish pastry is a multilayered sweet pastry containing a high amount of butter. However, carbs are the majority of the macronutrients this food contains. Danish pastry consists of approximately 37% carbohydrates.
Carbohydrates per 100g
Danish pastry provides 37.2g of carbs per 100g.
This amount equals 12% of the daily carbohydrate requirements.
Macronutrients chart
Danish pastry is higher in carbs than 75% of all foods.
Carbs per serving size
One serving of Danish pastry is 71 grams. This serving provides 26.4g of carbs.
Carbohydrate type breakdown
The fiber content is negligible, there is 1g of fiber per 100g.
The rest of the carbs, equalling 36.2g, is provided by net carbs, nearly 7g of which are sugars.
Fiber content ratio for Danish pastry
COMPARISON TO OTHER FOODS
| Food | Carbs per serving | Carbs per 100g |
| Danish pastry | 26.4g (71g) | 37.2g |
| French toast | 16.2g (65g) | 25g |
| Puff pastry | 18.3g (40g) | 45.7g |
| Blueberry pie | 49.2g (147g) | 33.5g |
| Muffin | 59.9g (113g) | 53g |
| Cherry pie | 69.3g (180g) | 38.5g |

Top nutrition facts for Danish pastry
| Calories ⓘ Calories for selected serving | 374 kcal |
|
Glycemic index ⓘ
Source: The GI for Danish Pastry, Apple & Peach, light https://www.sciencedirect.com/science/article/pii/S0002916522004944
Check out our Glycemic index chart page for the full list.
|
50 (low) |
| Glycemic load ⓘ Glycemic Load (GL) is a metric that measures both the quality (Glycemic Index) and quantity of carbohydrates in a specific serving of food to estimate its impact on blood sugar levels. It is calculated as: (GI × Carbs in grams) / 100. | 13 (medium) |
| Net carbs ⓘ Net Carbs = Total Carbohydrates – Fiber – Sugar Alcohols | 36 g |
| Default serving size ⓘ Serving sizes are mostly taken from FDA's Reference Amounts Customarily Consumed (RACCs) | 1 pastry (71 g) |
| Acidity (Based on PRAL) ⓘ PRAL (Potential renal acid load) is calculated using a formula. On the PRAL scale the higher the positive value, the more is the acidifying effect on the body. The lower the negative value, the higher the alkalinity of the food. 0 is neutral. | 5 (acidic) |
Danish pastry calories (kcal)
| Calories for different serving sizes of danish pastry | Calories | Weight |
|---|---|---|
| Calories in 100 grams | 374 | |
| Calories in 1 oz | 106 | 28.35 g |
| Calories in 1 pastry | 266 | 71 g |
| Calories for different varieties of danish pastry | Calories | Weight |
|---|---|---|
| Danish pastry, cheese (this food) | 374 | 100 g |
| Danish pastry, fruit, enriched (includes apple, cinnamon, raisin, lemon, raspberry, strawberry) | 371 | 100 g |
| Danish pastry, fruit, unenriched (includes apple, cinnamon, raisin, strawberry) | 371 | 100 g |
| Danish pastry, lemon, unenriched | 371 | 100 g |
| Danish pastry, raspberry, unenriched | 371 | 100 g |
| Danish pastry, cinnamon, enriched | 403 | 100 g |
| Danish pastry, cinnamon, unenriched | 403 | 100 g |
| Danish pastry, nut (includes almond, raisin nut, cinnamon nut) | 430 | 100 g |
Extra Nutrition facts for Danish pastry
| Protein per 100 calories ⓘ Shows how many grams of protein you get from 100 calories of this food, calculated as (protein in g ÷ calories) × 100. | 2.1 g |
| Calories per 10 g protein ⓘ Shows how many calories you need to eat from this food to get 10 g of protein, calculated as (calories ÷ protein in g) × 10. | 468 kcal |
| Weight per 100 calories ⓘ Shows how many grams of this food equal 100 kcal—higher grams mean a larger portion for the same calories. | 27 g |
| Unsaturated / Saturated Fat ratio ⓘ (monounsaturated + polyunsaturated) / saturated, ≥2 broadly recommended by major guidelines for heart health | 2 |
Danish pastry Glycemic index (GI)
Danish pastry Glycemic load (GL)
Mineral coverage chart
Mineral chart - relative view
Vitamin coverage chart
Vitamin chart - relative view
Protein quality breakdown
Fat type information
All nutrients for Danish pastry per 100g
| Nutrient | Value | DV% | In TOP % of foods | Comparison |
| Vitamin A | 35µg | 4% | 21% | |
| Calories | 374kcal | 19% | 19% |
8 times more than Orange
|
| Protein | 8g | 19% | 51% |
2.8 times more than Broccoli
|
| Protein per 100 calories | 2.1g | N/A | 70% | |
| Calories per 10 g protein | 468kcal | N/A | 27% | |
| Weight per 100 calories | 27g | N/A | 81% | |
| Unsaturated / Saturated Fat ratio | 2 | N/A | 43% | |
| Fats | 22g | 34% | 14% |
1.5 times less than Cheese
|
| Vitamin C | 0.1mg | 0% | 45% |
530 times less than Lemon
|
| Carbs | 37g | 12% | 25% |
1.3 times more than Rice
|
| Net carbs | 36g | N/A | 24% |
1.5 times less than Chocolate
|
| Cholesterol | 23mg | 8% | 38% |
16.2 times less than Egg
|
| Vitamin D* | 2 IU | 0% | 25% |
43.5 times less than Egg
|
| Vitamin D | 0µg | 0% | 100% |
N/A
|
| Magnesium | 15mg | 4% | 65% |
9.3 times less than Almonds
|
| Calcium | 35mg | 4% | 37% |
3.6 times less than Milk
|
| Potassium | 98mg | 3% | 79% |
1.5 times less than Cucumber
|
| Iron | 1.8mg | 23% | 40% |
1.4 times less than Beef broiled
|
| Sugar | 7g | N/A | 24% |
1.3 times less than Coca-Cola
|
| Fiber | 1g | 4% | 44% |
2.4 times less than Orange
|
| Copper | 0.09mg | 10% | 44% |
1.6 times less than Shiitake
|
| Zinc | 0.7mg | 6% | 54% |
9 times less than Beef broiled
|
| Phosphorus | 108mg | 15% | 56% |
1.7 times less than Chicken meat
|
| Sodium | 417mg | 18% | 25% |
1.2 times less than White bread
|
| Vitamin E | 0.35mg | 2% | 32% |
4.2 times less than Kiwi
|
| Manganese | 0.35mg | 15% | 19% | |
| Selenium | 19µg | 34% | 29% | |
| Vitamin B1 | 0.19mg | 16% | 29% |
1.4 times less than Pea raw
|
| Vitamin B2 | 0.26mg | 20% | 26% |
2 times more than Avocado
|
| Vitamin B3 | 2mg | 13% | 52% |
4.8 times less than Turkey meat
|
| Vitamin B5 | 0.3mg | 6% | 48% |
3.7 times less than Sunflower seeds
|
| Vitamin B6 | 0.04mg | 3% | 73% |
3 times less than Oats
|
| Vitamin B12 | 0.2µg | 8% | 45% |
3.5 times less than Pork
|
| Vitamin K | 6.9µg | 6% | 13% |
14.7 times less than Broccoli
|
| Folate | 60µg | 15% | 18% |
Equal to Brussels sprouts
|
| Choline | 20mg | 4% | 30% | |
| Saturated fat | 6.8g | 34% | 15% |
1.2 times more than Beef broiled
|
| Monounsaturated fat | 11g | N/A | 7% |
1.2 times more than Avocado
|
| Polyunsaturated fat | 2.6g | N/A | 20% |
18.3 times less than Walnut
|
| Tryptophan | 0.09mg | 0% | 39% |
3.4 times less than Chicken meat
|
| Threonine | 0.29mg | 0% | 38% |
2.5 times less than Beef broiled
|
| Isoleucine | 0.37mg | 0% | 37% |
2.5 times less than Salmon raw
|
| Leucine | 0.64mg | 0% | 38% |
3.8 times less than Tuna Bluefin
|
| Lysine | 0.43mg | 0% | 37% |
1.1 times less than Tofu
|
| Methionine | 0.17mg | 0% | 36% |
1.8 times more than Quinoa
|
| Phenylalanine | 0.4mg | 0% | 38% |
1.7 times less than Egg
|
| Valine | 0.41mg | 0% | 38% |
4.9 times less than Soybean raw
|
| Histidine | 0.21mg | 0% | 38% |
3.7 times less than Turkey meat
|
| Caffeine | 0mg | 0% | 100% | |
| Omega-3 - EPA | 0g | N/A | 100% |
N/A
|
| Omega-3 - DHA | 0g | N/A | 19% |
1460 times less than Salmon
|
| Omega-3 - DPA | 0g | N/A | 100% |
N/A
|
Check out similar food or compare with current
NUTRITION FACTS LABEL
Serving Size ______________
Health checks
Danish pastry nutrition infographic
References
All the values for which the sources are not specified explicitly are taken from FDA’s Food Central. The exact link to the food presented on this page can be found below.