Currant vs. Tamarind — In-Depth Nutrition Comparison
Compare
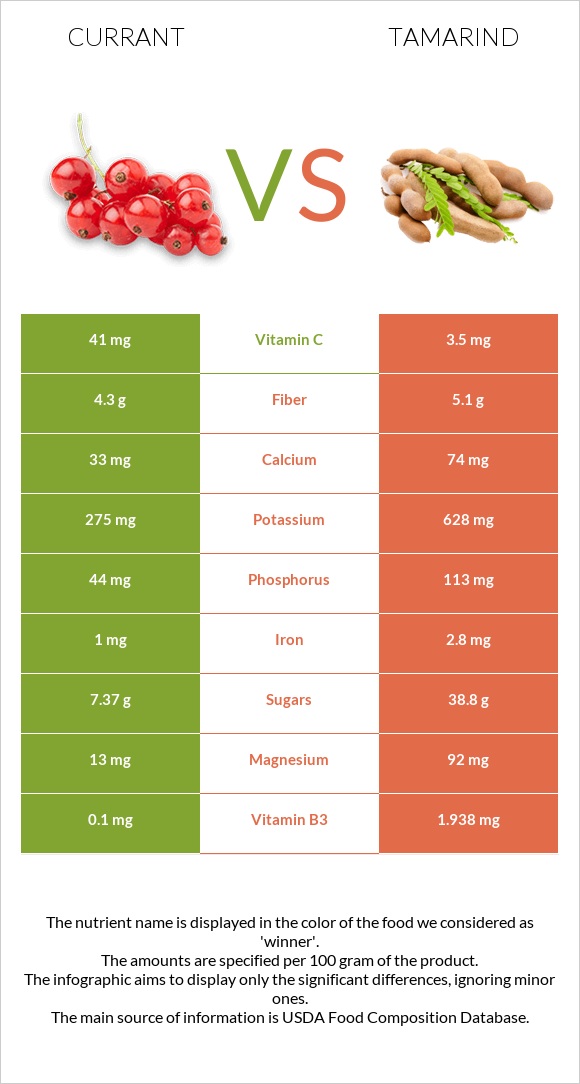
What are the main differences between currants and tamarind?
- Currants are richer in vitamin C and vitamin K, yet tamarind is richer in vitamin B1, iron, magnesium, vitamin B3, potassium, phosphorus, and vitamin B2.
- Currants' daily need coverage for vitamin C is 42% higher.
- Currants have 4 times more vitamin K than tamarind. Currants have 11µg of vitamin K, while tamarind has 2.8µg.
We used Currants, red, and white, raw and Tamarinds, raw types in this comparison.
Infographic

Infographic link
Mineral Comparison
Mineral comparison score is based on the number of minerals by which one or the other food is richer. The "coverage" charts below show how much of the daily needs can be covered by 300 grams of the food.
Contains more CopperCopper | +24.4% |
Contains more ZincZinc | +130% |
Contains less SodiumSodium | -96.4% |
Contains more ManganeseManganese | +∞% |
Contains more MagnesiumMagnesium | +607.7% |
Contains more CalciumCalcium | +124.2% |
Contains more PotassiumPotassium | +128.4% |
Contains more IronIron | +180% |
Contains more PhosphorusPhosphorus | +156.8% |
Contains more SeleniumSelenium | +116.7% |
Vitamin Comparison
Vitamin comparison score is based on the number of vitamins by which one or the other food is richer. The "coverage" charts below show how much of the daily needs can be covered by 300 grams of the food.
Contains more Vitamin CVitamin C | +1071.4% |
Contains more Vitamin KVitamin K | +292.9% |
Contains more Vitamin B1Vitamin B1 | +970% |
Contains more Vitamin B2Vitamin B2 | +204% |
Contains more Vitamin B3Vitamin B3 | +1838% |
Contains more Vitamin B5Vitamin B5 | +123.4% |
Contains more FolateFolate | +75% |
Contains more CholineCholine | +13.2% |
All nutrients comparison - raw data values
Nutrient | ![]() |
![]() |
DV% diff. |
Vitamin C | 41mg | 3.5mg | 42% |
Vitamin B1 | 0.04mg | 0.428mg | 32% |
Iron | 1mg | 2.8mg | 23% |
Magnesium | 13mg | 92mg | 19% |
Carbs | 13.8g | 62.5g | 16% |
Vitamin B3 | 0.1mg | 1.938mg | 11% |
Phosphorus | 44mg | 113mg | 10% |
Potassium | 275mg | 628mg | 10% |
Calories | 56kcal | 239kcal | 9% |
Vitamin B2 | 0.05mg | 0.152mg | 8% |
Manganese | 0.186mg | 8% | |
Vitamin K | 11µg | 2.8µg | 7% |
Fructose | 3.53g | 4% | |
Calcium | 33mg | 74mg | 4% |
Protein | 1.4g | 2.8g | 3% |
Fiber | 4.3g | 5.1g | 3% |
Folate | 8µg | 14µg | 2% |
Vitamin B5 | 0.064mg | 0.143mg | 2% |
Copper | 0.107mg | 0.086mg | 2% |
Zinc | 0.23mg | 0.1mg | 1% |
Sodium | 1mg | 28mg | 1% |
Saturated fat | 0.017g | 0.272g | 1% |
Selenium | 0.6µg | 1.3µg | 1% |
Fats | 0.2g | 0.6g | 1% |
Net carbs | 9.5g | 57.4g | N/A |
Sugar | 7.37g | 38.8g | N/A |
Vitamin E | 0.1mg | 0.1mg | 0% |
Vitamin A | 2µg | 2µg | 0% |
Vitamin B6 | 0.07mg | 0.066mg | 0% |
Choline | 7.6mg | 8.6mg | 0% |
Monounsaturated fat | 0.028g | 0.181g | 0% |
Polyunsaturated fat | 0.088g | 0.059g | 0% |
Tryptophan | 0.018mg | 0% | |
Lysine | 0.139mg | 0% | |
Methionine | 0.014mg | 0% |
Macronutrient Comparison
Macronutrient breakdown side-by-side comparison
Contains more WaterWater | +167.4% |
Contains more ProteinProtein | +100% |
Contains more FatsFats | +200% |
Contains more CarbsCarbs | +352.9% |
Contains more OtherOther | +315.4% |
Fat Type Comparison
Fat type breakdown side-by-side comparison
Contains less Sat. FatSaturated fat | -93.8% |
Contains more Poly. FatPolyunsaturated fat | +49.2% |
Contains more Mono. FatMonounsaturated fat | +546.4% |