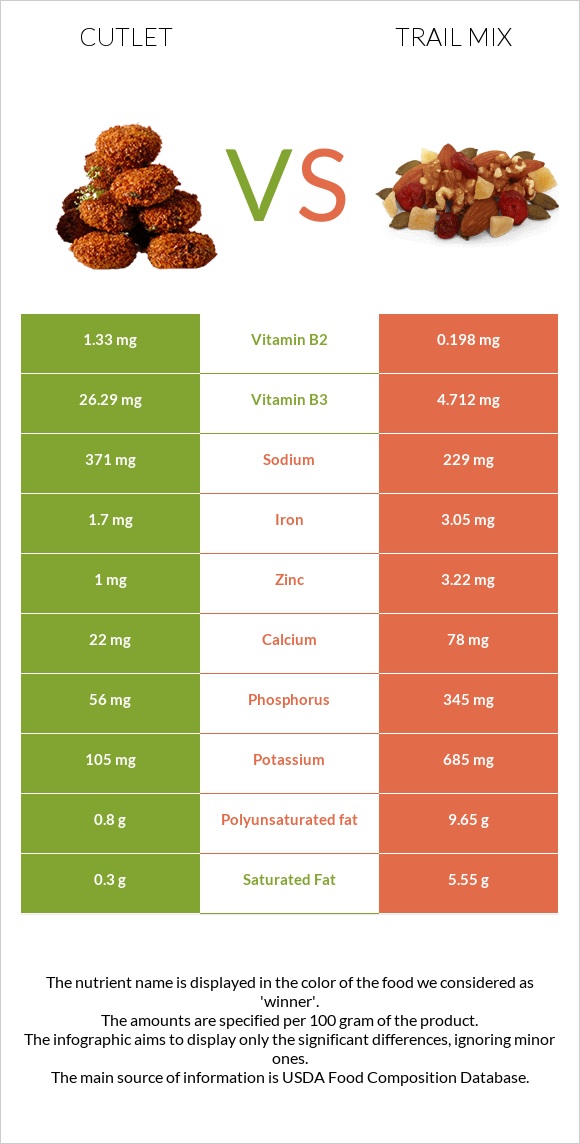
A recap on the differences between cutlet and trail mix Cutlet is higher in vitamin B3 and vitamin B2, yet trail mix is higher in phosphorus, magnesium, vitamin B1, zinc, folate, potassium, and iron. Cutlet covers your daily vitamin B3 needs 135% more than trail mix. Cutlet contains 7 times more vitamin B2 than trail mix. While cutlet contains 1.33mg of vitamin B2, trail mix contains only 0.198mg. The amount of saturated fat in cutlet is lower. The glycemic index of cutlet is lower. Food varieties used in this article are WORTHINGTON Multigrain Cutlets, canned, unprepared and Snacks, trail mix, regular .
Infographic
Mineral Comparison
Mineral comparison score is based on the number of minerals by which one or the other food is richer. The "coverage" charts below show how much of the daily needs can be covered by 300 grams of the food.
0
100 g
300 g
2 slices - 92g
Magnesium
Magnesium
Calcium
Calcium
Potassium
Potassium
Iron
Iron
Copper
Copper
Zinc
Zinc
Phosphorus
Phosphorus
Sodium
Sodium
Manganese
Manganese
Selenium
Selenium
2.1%
6.6%
9.3%
64%
0%
27%
24%
48%
0%
0%
9
100 g
300 g
1 oz - 28.35g 1.5 oz - 42g 1 cup - 150g
Magnesium
Magnesium
Calcium
Calcium
Potassium
Potassium
Iron
Iron
Copper
Copper
Zinc
Zinc
Phosphorus
Phosphorus
Sodium
Sodium
Manganese
Manganese
Selenium
Selenium
113%
23%
60%
114%
328%
88%
148%
30%
135%
0%
Vitamin Comparison
Vitamin comparison score is based on the number of vitamins by which one or the other food is richer. The "coverage" charts below show how much of the daily needs can be covered by 300 grams of the food.
4
100 g
300 g
2 slices - 92g
Vitamin C
Vit. C
Vitamin D
Vit. D
Vitamin A
Vit. A
Vitamin E
Vit. E
Vitamin B1
Vit. B1
Vitamin B2
Vit. B2
Vitamin B3
Vit. B3
Vitamin B5
Vit. B5
Vitamin B6
Vit. B6
Vitamin B12
Vit. B12
Vitamin K
Vit. K
Folate
Folate
0%
0%
0%
362%
13%
307%
493%
0%
115%
0%
0%
1.5%
5
100 g
300 g
1 oz - 28.35g 1.5 oz - 42g 1 cup - 150g
Vitamin C
Vit. C
Vitamin D
Vit. D
Vitamin A
Vit. A
Vitamin E
Vit. E
Vitamin B1
Vit. B1
Vitamin B2
Vit. B2
Vitamin B3
Vit. B3
Vitamin B5
Vit. B5
Vitamin B6
Vit. B6
Vitamin B12
Vit. B12
Vitamin K
Vit. K
Folate
Folate
4.7%
0%
0.33%
0%
116%
46%
88%
54%
69%
0%
0%
53%
All nutrients comparison - raw data values
Nutrient
DV% diff.
Vitamin B3
26.29mg
4.712mg
135%
Vitamin E
18.09mg
121%
Copper
0.985mg
109%
Vitamin B2
1.33mg
0.198mg
87%
Polyunsaturated fat
0.8g
9.65g
59%
Manganese
1.034mg
45%
Fats
1.5g
29.4g
43%
Phosphorus
56mg
345mg
41%
Magnesium
3mg
158mg
37%
Vitamin B1
0.05mg
0.462mg
34%
Monounsaturated fat
0.2g
12.53g
31%
Saturated fat
0.3g
5.55g
24%
Zinc
1mg
3.22mg
20%
Protein
23.29g
13.8g
19%
Fiber
4.5g
18%
Vitamin B5
0.895mg
18%
Calories
117kcal
462kcal
17%
Potassium
105mg
685mg
17%
Iron
1.7mg
3.05mg
17%
Folate
2µg
71µg
17%
Vitamin B6
0.5mg
0.298mg
16%
Carbs
7.3g
44.9g
13%
Calcium
22mg
78mg
6%
Sodium
371mg
229mg
6%
Vitamin C
0mg
1.4mg
2%
Protein per 100 calories
20g
3g
N/A
Calories per 10 g protein
50kcal
335kcal
N/A
Weight per 100 calories
85g
22g
N/A
Unsaturated / Saturated Fat ratio
3.3
4
N/A
Net carbs
2.8g
44.9g
N/A
Sugar
0.2g
N/A
Vitamin A
1µg
0%
Tryptophan
0.166mg
0%
Threonine
0.482mg
0%
Isoleucine
0.515mg
0%
Leucine
0.89mg
0%
Lysine
0.515mg
0%
Methionine
0.202mg
0%
Phenylalanine
0.658mg
0%
Valine
0.658mg
0%
Histidine
0.357mg
0%
Macronutrient Comparison
Macronutrient breakdown side-by-side comparison
2
23%
7%
67%
Protein:
23.29 g
Fats:
1.5 g
Carbs:
7.3 g
Water:
66.69 g
Other:
1.22 g
3
14%
29%
45%
9%
3%
Protein:
13.8 g
Fats:
29.4 g
Carbs:
44.9 g
Water:
9.2 g
Other:
2.7 g
Contains
more
Protein Protein
+68.8%
Contains
more
Water Water
+624.9%
Contains
more
Fats Fats
+1860%
Contains
more
Carbs Carbs
+515.1%
Contains
more
Other Other
+121.3%
Fat Type Comparison
Fat type breakdown side-by-side comparison
1
23%
15%
62%
Saturated fat:
Sat. Fat
0.3 g
Monounsaturated fat:
Mono. Fat
0.2 g
Polyunsaturated fat:
Poly. Fat
0.8 g
2
20%
45%
35%
Saturated fat:
Sat. Fat
5.55 g
Monounsaturated fat:
Mono. Fat
12.53 g
Polyunsaturated fat:
Poly. Fat
9.65 g
Contains
less
Sat. Fat Saturated fat
-94.6%
Contains
more
Mono. Fat Monounsaturated fat
+6165%
Contains
more
Poly. Fat Polyunsaturated fat
+1106.3%