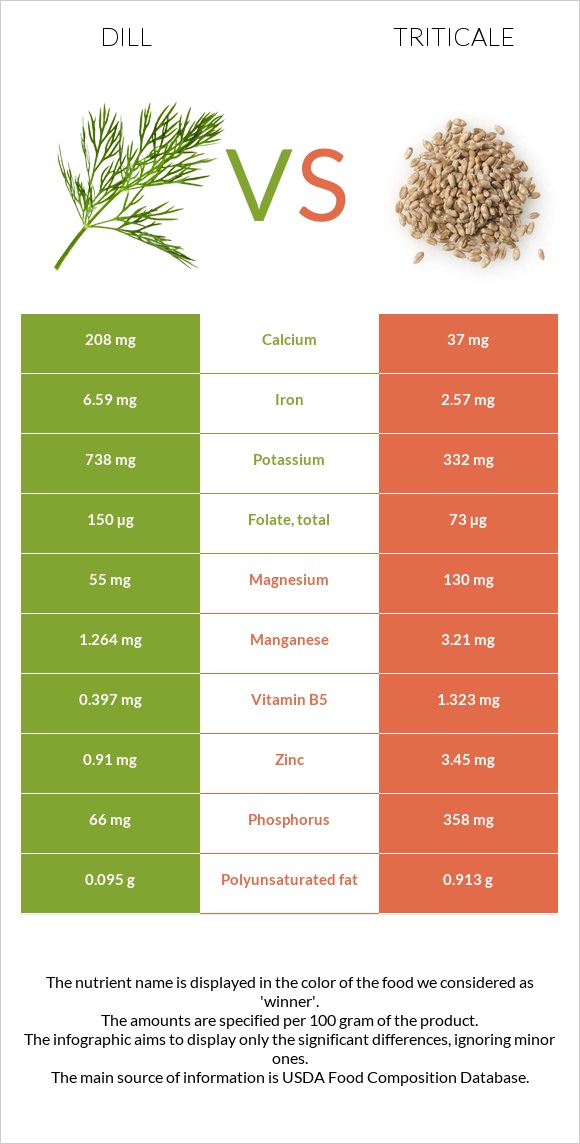
The main differences between dill and triticale Dill is richer in vitamin A, vitamin C, iron, and folate, yet triticale is richer in manganese, phosphorus, copper, vitamin B1, zinc, and vitamin B5. Daily need coverage for vitamin A for dill is 154% higher. Dill has a lower glycemic index than triticale. Food types used in this article are Dill weed, fresh and Triticale .
Infographic
Mineral Comparison
Mineral comparison score is based on the number of minerals by which one or the other food is richer. The "coverage" charts below show how much of the daily needs can be covered by 300 grams of the food.
3
100 g
300 g
5 sprigs - 1g 1 cup sprigs - 8.9g
Magnesium
Magnesium
Calcium
Calcium
Potassium
Potassium
Iron
Iron
Copper
Copper
Zinc
Zinc
Phosphorus
Phosphorus
Sodium
Sodium
Manganese
Manganese
Selenium
Selenium
39%
62%
65%
247%
49%
25%
28%
8%
165%
0%
6
100 g
300 g
1 cup - 192g
Magnesium
Magnesium
Calcium
Calcium
Potassium
Potassium
Iron
Iron
Copper
Copper
Zinc
Zinc
Phosphorus
Phosphorus
Sodium
Sodium
Manganese
Manganese
Selenium
Selenium
93%
11%
29%
96%
152%
94%
153%
0.65%
419%
0%
Vitamin Comparison
Vitamin comparison score is based on the number of vitamins by which one or the other food is richer. The "coverage" charts below show how much of the daily needs can be covered by 300 grams of the food.
5
100 g
300 g
5 sprigs - 1g 1 cup sprigs - 8.9g
Vitamin C
Vit. C
Vitamin D
Vit. D
Vitamin A
Vit. A
Vitamin E
Vit. E
Vitamin B1
Vit. B1
Vitamin B2
Vit. B2
Vitamin B3
Vit. B3
Vitamin B5
Vit. B5
Vitamin B6
Vit. B6
Vitamin B12
Vit. B12
Vitamin K
Vit. K
Folate
Folate
283%
0%
129%
0%
15%
68%
29%
24%
43%
0%
0%
113%
3
100 g
300 g
1 cup - 192g
Vitamin C
Vit. C
Vitamin D
Vit. D
Vitamin A
Vit. A
Vitamin E
Vit. E
Vitamin B1
Vit. B1
Vitamin B2
Vit. B2
Vitamin B3
Vit. B3
Vitamin B5
Vit. B5
Vitamin B6
Vit. B6
Vitamin B12
Vit. B12
Vitamin K
Vit. K
Folate
Folate
0%
0%
0%
18%
104%
31%
27%
79%
32%
0%
0%
55%
All nutrients comparison - raw data values
Nutrient
DV% diff.
Vitamin C
85mg
0mg
94%
Manganese
1.264mg
3.21mg
85%
Iron
6.59mg
2.57mg
50%
Vitamin A
386µg
0µg
43%
Phosphorus
66mg
358mg
42%
Copper
0.146mg
0.457mg
35%
Vitamin B1
0.058mg
0.416mg
30%
Zinc
0.91mg
3.45mg
23%
Carbs
7.02g
72.13g
22%
Protein
3.46g
13.05g
19%
Vitamin B5
0.397mg
1.323mg
19%
Folate
150µg
73µg
19%
Magnesium
55mg
130mg
18%
Calcium
208mg
37mg
17%
Calories
43kcal
336kcal
15%
Potassium
738mg
332mg
12%
Vitamin B2
0.296mg
0.134mg
12%
Fiber
2.1g
8%
Vitamin E
0.9mg
6%
Polyunsaturated fat
0.095g
0.913g
5%
Vitamin B6
0.185mg
0.138mg
4%
Sodium
61mg
5mg
2%
Fats
1.12g
2.09g
1%
Vitamin B3
1.57mg
1.43mg
1%
Saturated fat
0.06g
0.366g
1%
Monounsaturated fat
0.802g
0.211g
1%
Protein per 100 calories
8g
3.9g
N/A
Calories per 10 g protein
124kcal
257kcal
N/A
Weight per 100 calories
233g
30g
N/A
Unsaturated / Saturated Fat ratio
15
3.1
N/A
Net carbs
4.92g
72.13g
N/A
Tryptophan
0.014mg
0.157mg
0%
Threonine
0.068mg
0.405mg
0%
Isoleucine
0.195mg
0.479mg
0%
Leucine
0.159mg
0.911mg
0%
Lysine
0.246mg
0.365mg
0%
Methionine
0.011mg
0.204mg
0%
Phenylalanine
0.065mg
0.638mg
0%
Valine
0.154mg
0.609mg
0%
Histidine
0.071mg
0.311mg
0%
Macronutrient Comparison
Macronutrient breakdown side-by-side comparison
2
3%
7%
86%
2%
Protein:
3.46 g
Fats:
1.12 g
Carbs:
7.02 g
Water:
85.95 g
Other:
2.45 g
3
13%
2%
72%
11%
2%
Protein:
13.05 g
Fats:
2.09 g
Carbs:
72.13 g
Water:
10.51 g
Other:
2.22 g
Contains
more
Water Water
+717.8%
Contains
more
Protein Protein
+277.2%
Contains
more
Fats Fats
+86.6%
Contains
more
Carbs Carbs
+927.5%
Fat Type Comparison
Fat type breakdown side-by-side comparison
2
6%
84%
10%
Saturated fat:
Sat. Fat
0.06 g
Monounsaturated fat:
Mono. Fat
0.802 g
Polyunsaturated fat:
Poly. Fat
0.095 g
1
25%
14%
61%
Saturated fat:
Sat. Fat
0.366 g
Monounsaturated fat:
Mono. Fat
0.211 g
Polyunsaturated fat:
Poly. Fat
0.913 g
Contains
less
Sat. Fat Saturated fat
-83.6%
Contains
more
Mono. Fat Monounsaturated fat
+280.1%
Contains
more
Poly. Fat Polyunsaturated fat
+861.1%