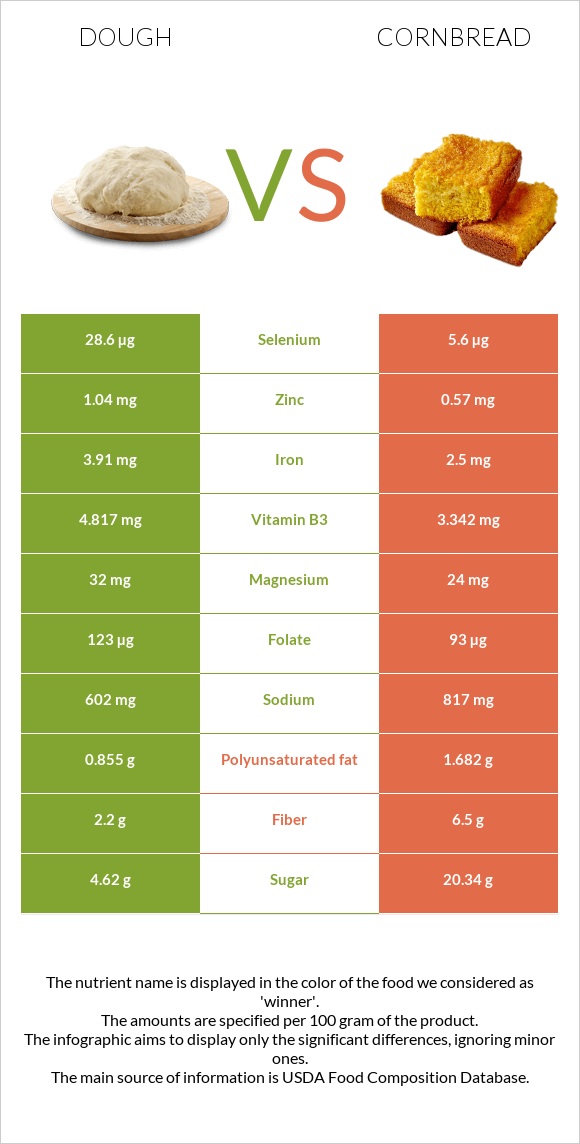
Important differences between dough and cornbread Dough has more vitamin B1, selenium, iron, vitamin B2, vitamin B3, folate, and manganese; however, cornbread has more phosphorus. Dough's daily need coverage for vitamin B1 is 43% more. Dough has 3 times more selenium than cornbread. Dough has 28.6µg of selenium, while cornbread has 8.7µg. Dough is lower in saturated fat. The food varieties used in the comparison are Bread, french or vienna (includes sourdough) and Bread, cornbread, dry mix, prepared with 2% milk, 80% margarine, and eggs .
Infographic
Mineral Comparison
Mineral comparison score is based on the number of minerals by which one or the other food is richer. The "coverage" charts below show how much of the daily needs can be covered by 300 grams of the food.
6
100 g
300 g
1 oz - 28.35g 1 slice - 139g
Magnesium
Magnesium
Calcium
Calcium
Potassium
Potassium
Iron
Iron
Copper
Copper
Zinc
Zinc
Phosphorus
Phosphorus
Sodium
Sodium
Manganese
Manganese
Selenium
Selenium
23%
16%
10%
147%
51%
28%
45%
79%
75%
156%
3
100 g
300 g
1 oz - 28.35g 1 muffin - 51g 1 piece - 60g
Magnesium
Magnesium
Calcium
Calcium
Potassium
Potassium
Iron
Iron
Copper
Copper
Zinc
Zinc
Phosphorus
Phosphorus
Sodium
Sodium
Manganese
Manganese
Selenium
Selenium
12%
41%
12%
69%
24%
18%
168%
78%
29%
47%
Vitamin Comparison
Vitamin comparison score is based on the number of vitamins by which one or the other food is richer. The "coverage" charts below show how much of the daily needs can be covered by 300 grams of the food.
5
100 g
300 g
1 oz - 28.35g 1 slice - 139g
Vitamin C
Vit. C
Vitamin D
Vit. D
Vitamin A
Vit. A
Vitamin E
Vit. E
Vitamin B1
Vit. B1
Vitamin B2
Vit. B2
Vitamin B3
Vit. B3
Vitamin B5
Vit. B5
Vitamin B6
Vit. B6
Vitamin B12
Vit. B12
Vitamin K
Vit. K
Folate
Folate
0%
0%
0%
4.2%
178%
99%
90%
27%
25%
0%
1.8%
92%
6
100 g
300 g
1 oz - 28.35g 1 muffin - 51g 1 piece - 60g
Vitamin C
Vit. C
Vitamin D
Vit. D
Vitamin A
Vit. A
Vitamin E
Vit. E
Vitamin B1
Vit. B1
Vitamin B2
Vit. B2
Vitamin B3
Vit. B3
Vitamin B5
Vit. B5
Vitamin B6
Vit. B6
Vitamin B12
Vit. B12
Vitamin K
Vit. K
Folate
Folate
0.33%
0%
12%
10%
48%
40%
38%
35%
20%
29%
9.3%
41%
All nutrients comparison - raw data values
Nutrient
DV% diff.
Vitamin B1
0.71mg
0.19mg
43%
Phosphorus
105mg
391mg
41%
Selenium
28.6µg
8.7µg
36%
Iron
3.91mg
1.85mg
26%
Cholesterol
0mg
57mg
19%
Vitamin B2
0.427mg
0.175mg
19%
Vitamin B3
4.817mg
2.004mg
18%
Folate
123µg
55µg
17%
Manganese
0.577mg
0.222mg
15%
Saturated fat
0.529g
3.732g
15%
Fats
2.42g
9.58g
11%
Vitamin B12
0µg
0.23µg
10%
Copper
0.152mg
0.073mg
9%
Choline
8mg
58.7mg
9%
Protein
10.75g
6.59g
8%
Calcium
52mg
135mg
8%
Monounsaturated fat
0.362g
3.494g
8%
Polyunsaturated fat
0.855g
1.963g
7%
Magnesium
32mg
17mg
4%
Starch
44.23g
35.66g
4%
Vitamin A
0µg
35µg
4%
Calories
272kcal
330kcal
3%
Zinc
1.04mg
0.67mg
3%
Vitamin K
0.7µg
3.7µg
3%
Vitamin E
0.21mg
0.51mg
2%
Vitamin B5
0.455mg
0.579mg
2%
Vitamin B6
0.107mg
0.085mg
2%
Carbs
51.88g
54.46g
1%
Protein per 100 calories
4g
2g
N/A
Calories per 10 g protein
253kcal
501kcal
N/A
Weight per 100 calories
37g
30g
N/A
Unsaturated / Saturated Fat ratio
2.3
1.5
N/A
Vitamin C
0mg
0.1mg
0%
Net carbs
49.68g
52.16g
N/A
Potassium
117mg
133mg
0%
Sugar
4.62g
16.05g
N/A
Fiber
2.2g
2.3g
0%
Sodium
602mg
599mg
0%
Trans fat
0.005g
0.224g
N/A
Tryptophan
0.059mg
0%
Threonine
0.226mg
0%
Isoleucine
0.265mg
0%
Leucine
0.658mg
0%
Lysine
0.324mg
0%
Methionine
0.157mg
0%
Phenylalanine
0.343mg
0%
Valine
0.334mg
0%
Histidine
0.167mg
0%
Fructose
0.51g
0.2g
0%
Omega-3 - DHA
0g
0.007g
N/A
Omega-3 - ALA
0.063g
0.076g
N/A
Omega-3 - DPA
0g
0.003g
N/A
Omega-3 - Eicosatrienoic acid
0g
0.004g
N/A
Omega-6 - Gamma-linoleic acid
0.001g
0.004g
N/A
Omega-6 - Dihomo-gamma-linoleic acid
0g
0.009g
N/A
Omega-6 - Eicosadienoic acid
0g
0.043g
N/A
Omega-6 - Linoleic acid
0.788g
1.726g
N/A
Macronutrient Comparison
Macronutrient breakdown side-by-side comparison
2
11%
2%
52%
33%
2%
Protein:
10.75 g
Fats:
2.42 g
Carbs:
51.88 g
Water:
33 g
Other:
1.95 g
3
7%
10%
54%
27%
2%
Protein:
6.59 g
Fats:
9.58 g
Carbs:
54.46 g
Water:
27.11 g
Other:
2.26 g
Contains
more
Protein Protein
+63.1%
Contains
more
Water Water
+21.7%
Contains
more
Fats Fats
+295.9%
Contains
more
Other Other
+15.9%
Fat Type Comparison
Fat type breakdown side-by-side comparison
1
30%
21%
49%
Saturated fat:
Sat. Fat
0.529 g
Monounsaturated fat:
Mono. Fat
0.362 g
Polyunsaturated fat:
Poly. Fat
0.855 g
2
41%
38%
21%
Saturated fat:
Sat. Fat
3.732 g
Monounsaturated fat:
Mono. Fat
3.494 g
Polyunsaturated fat:
Poly. Fat
1.963 g
Contains
less
Sat. Fat Saturated fat
-85.8%
Contains
more
Mono. Fat Monounsaturated fat
+865.2%
Contains
more
Poly. Fat Polyunsaturated fat
+129.6%
Carbohydrate type comparison
Carbohydrate type breakdown side-by-side comparison
4
91%
8%
Starch:
44.23 g
Sucrose:
0 g
Glucose:
0.4 g
Fructose:
0.51 g
Lactose:
0 g
Maltose:
3.7 g
Galactose:
0 g
2
69%
28%
2%
Starch:
35.66 g
Sucrose:
14.45 g
Glucose:
0.29 g
Fructose:
0.2 g
Lactose:
1.05 g
Maltose:
0.06 g
Galactose:
0 g
Contains
more
Starch Starch
+24%
Contains
more
Glucose Glucose
+37.9%
Contains
more
Fructose Fructose
+155%
Contains
more
Maltose Maltose
+6066.7%
Contains
more
Sucrose Sucrose
+∞%
Contains
more
Lactose Lactose
+∞%