Differences between dough and crouton Dough has more vitamin B2, vitamin B1, and vitamin B6, while crouton has more selenium, fiber, and monounsaturated fat. Crouton's daily need coverage for selenium is 16% higher. Crouton contains 4 times less vitamin B6 than dough. Dough contains 0.107mg of vitamin B6, while crouton contains 0.026mg. The amount of sodium in dough is lower. The food types used in this comparison are Bread, french or vienna (includes sourdough) and Croutons, plain .
Infographic
Mineral Comparison
Mineral comparison score is based on the number of minerals by which one or the other food is richer. The "coverage" charts below show how much of the daily needs can be covered by 300 grams of the food.
3
100 g
300 g
1 oz - 28.35g 1 slice - 139g
Magnesium
Magnesium
Calcium
Calcium
Potassium
Potassium
Iron
Iron
Copper
Copper
Zinc
Zinc
Phosphorus
Phosphorus
Sodium
Sodium
Manganese
Manganese
Selenium
Selenium
23%
16%
10%
147%
51%
28%
45%
79%
75%
156%
2
100 g
300 g
0.5 oz - 14.2g 1 cup - 30g
Magnesium
Magnesium
Calcium
Calcium
Potassium
Potassium
Iron
Iron
Copper
Copper
Zinc
Zinc
Phosphorus
Phosphorus
Sodium
Sodium
Manganese
Manganese
Selenium
Selenium
22%
23%
11%
153%
54%
24%
49%
91%
65%
205%
Vitamin Comparison
Vitamin comparison score is based on the number of vitamins by which one or the other food is richer. The "coverage" charts below show how much of the daily needs can be covered by 300 grams of the food.
5
100 g
300 g
1 oz - 28.35g 1 slice - 139g
Vitamin C
Vit. C
Vitamin D
Vit. D
Vitamin A
Vit. A
Vitamin E
Vit. E
Vitamin B1
Vit. B1
Vitamin B2
Vit. B2
Vitamin B3
Vit. B3
Vitamin B5
Vit. B5
Vitamin B6
Vit. B6
Vitamin B12
Vit. B12
Vitamin K
Vit. K
Folate
Folate
0%
0%
0%
4.2%
178%
99%
90%
27%
25%
0%
1.8%
92%
1
100 g
300 g
0.5 oz - 14.2g 1 cup - 30g
Vitamin C
Vit. C
Vitamin D
Vit. D
Vitamin A
Vit. A
Vitamin E
Vit. E
Vitamin B1
Vit. B1
Vitamin B2
Vit. B2
Vitamin B3
Vit. B3
Vitamin B5
Vit. B5
Vitamin B6
Vit. B6
Vitamin B12
Vit. B12
Vitamin K
Vit. K
Folate
Folate
0%
0%
0%
0%
156%
63%
102%
26%
6%
0%
0%
99%
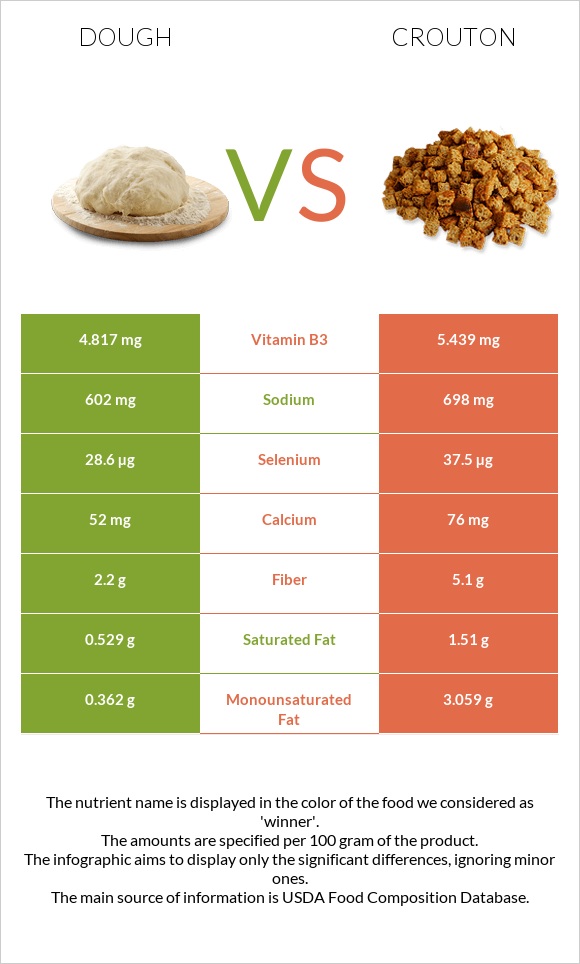
All nutrients comparison - raw data values
Nutrient
DV% diff.
Starch
44.23g
18%
Selenium
28.6µg
37.5µg
16%
Fiber
2.2g
5.1g
12%
Vitamin B2
0.427mg
0.272mg
12%
Calories
272kcal
407kcal
7%
Carbs
51.88g
73.5g
7%
Vitamin B1
0.71mg
0.623mg
7%
Monounsaturated fat
0.362g
3.059g
7%
Fats
2.42g
6.6g
6%
Vitamin B6
0.107mg
0.026mg
6%
Sodium
602mg
698mg
4%
Vitamin B3
4.817mg
5.439mg
4%
Saturated fat
0.529g
1.51g
4%
Manganese
0.577mg
0.5mg
3%
Polyunsaturated fat
0.855g
1.273g
3%
Protein
10.75g
11.9g
2%
Calcium
52mg
76mg
2%
Iron
3.91mg
4.08mg
2%
Folate
123µg
132µg
2%
Copper
0.152mg
0.163mg
1%
Zinc
1.04mg
0.89mg
1%
Phosphorus
105mg
115mg
1%
Vitamin E
0.21mg
1%
Vitamin B5
0.455mg
0.429mg
1%
Vitamin K
0.7µg
1%
Choline
8mg
1%
Fructose
0.51g
1%
Protein per 100 calories
4g
2.9g
N/A
Calories per 10 g protein
253kcal
342kcal
N/A
Weight per 100 calories
37g
25g
N/A
Unsaturated / Saturated Fat ratio
2.3
2.9
N/A
Net carbs
49.68g
68.4g
N/A
Magnesium
32mg
31mg
0%
Potassium
117mg
124mg
0%
Sugar
4.62g
N/A
Trans fat
0.005g
N/A
Tryptophan
0.14mg
0%
Threonine
0.337mg
0%
Isoleucine
0.456mg
0%
Leucine
0.832mg
0%
Lysine
0.278mg
0%
Methionine
0.211mg
0%
Phenylalanine
0.586mg
0%
Valine
0.514mg
0%
Histidine
0.255mg
0%
Omega-3 - ALA
0.063g
N/A
Omega-6 - Gamma-linoleic acid
0.001g
N/A
Omega-6 - Linoleic acid
0.788g
N/A
Macronutrient Comparison
Macronutrient breakdown side-by-side comparison
1
11%
2%
52%
33%
2%
Protein:
10.75 g
Fats:
2.42 g
Carbs:
51.88 g
Water:
33 g
Other:
1.95 g
4
12%
7%
74%
6%
3%
Protein:
11.9 g
Fats:
6.6 g
Carbs:
73.5 g
Water:
5.5 g
Other:
2.5 g
Contains
more
Water Water
+500%
Contains
more
Protein Protein
+10.7%
Contains
more
Fats Fats
+172.7%
Contains
more
Carbs Carbs
+41.7%
Contains
more
Other Other
+28.2%
Fat Type Comparison
Fat type breakdown side-by-side comparison
1
30%
21%
49%
Saturated fat:
Sat. Fat
0.529 g
Monounsaturated fat:
Mono. Fat
0.362 g
Polyunsaturated fat:
Poly. Fat
0.855 g
2
26%
52%
22%
Saturated fat:
Sat. Fat
1.51 g
Monounsaturated fat:
Mono. Fat
3.059 g
Polyunsaturated fat:
Poly. Fat
1.273 g
Contains
less
Sat. Fat Saturated fat
-65%
Contains
more
Mono. Fat Monounsaturated fat
+745%
Contains
more
Poly. Fat Polyunsaturated fat
+48.9%