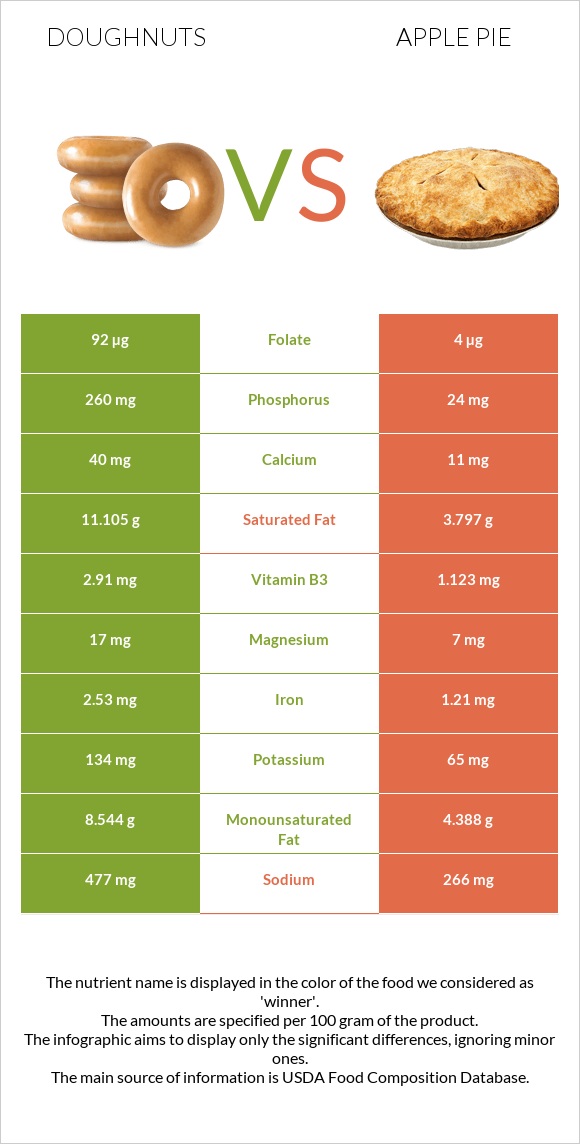
Differences between doughnuts and apple pie Apple pie contains less phosphorus, folate, vitamin B1, iron, vitamin B3, vitamin B2, manganese, and vitamin B5 than doughnuts. Doughnuts' daily need coverage for saturated fat is 37% higher. Apple pie contains 23 times less folate than doughnuts. Doughnuts contain 92µg of folate, while apple pie contains 4µg. The amount of saturated fat in apple pie is lower. Apple pie has a lower glycemic index. The glycemic index of apple pie is 41, while the glycemic index of doughnuts is 75. The food types used in this comparison are Doughnuts, cake-type, plain (includes unsugared, old-fashioned) and Pie, apple, commercially prepared, unenriched flour .
Infographic
Mineral Comparison
Mineral comparison score is based on the number of minerals by which one or the other food is richer. The "coverage" charts below show how much of the daily needs can be covered by 300 grams of the food.
9
100 g
300 g
1 doughnut, mini (1-1/2" dia) or doughnut hole - 14g 1 oz - 28.35g 1 donut - 40g 1 doughnut stick - 52g 1 doughnut, long type (twist) (4-1/2" long) - 52g 1 doughnut medium (3-1/4" dia) - 54g 1 doughnut, large (4" dia) - 71g
Magnesium
Magnesium
Calcium
Calcium
Potassium
Potassium
Iron
Iron
Copper
Copper
Zinc
Zinc
Phosphorus
Phosphorus
Sodium
Sodium
Manganese
Manganese
Selenium
Selenium
12%
12%
12%
95%
30%
14%
111%
62%
43%
55%
1
100 g
300 g
1 oz - 28.35g 1 piece (1/6 of 8" pie) - 117g 1 piece (1/8 of 9" dia) - 125g
Magnesium
Magnesium
Calcium
Calcium
Potassium
Potassium
Iron
Iron
Copper
Copper
Zinc
Zinc
Phosphorus
Phosphorus
Sodium
Sodium
Manganese
Manganese
Selenium
Selenium
5%
3.3%
5.7%
45%
15%
4.4%
10%
35%
24%
0%
Vitamin Comparison
Vitamin comparison score is based on the number of vitamins by which one or the other food is richer. The "coverage" charts below show how much of the daily needs can be covered by 300 grams of the food.
9
100 g
300 g
1 doughnut, mini (1-1/2" dia) or doughnut hole - 14g 1 oz - 28.35g 1 donut - 40g 1 doughnut stick - 52g 1 doughnut, long type (twist) (4-1/2" long) - 52g 1 doughnut medium (3-1/4" dia) - 54g 1 doughnut, large (4" dia) - 71g
Vitamin C
Vit. C
Vitamin D
Vit. D
Vitamin A
Vit. A
Vitamin E
Vit. E
Vitamin B1
Vit. B1
Vitamin B2
Vit. B2
Vitamin B3
Vit. B3
Vitamin B5
Vit. B5
Vitamin B6
Vit. B6
Vitamin B12
Vit. B12
Vitamin K
Vit. K
Folate
Folate
0%
0%
1.3%
40%
98%
69%
55%
23%
12%
7.5%
25%
69%
2
100 g
300 g
1 oz - 28.35g 1 piece (1/6 of 8" pie) - 117g 1 piece (1/8 of 9" dia) - 125g
Vitamin C
Vit. C
Vitamin D
Vit. D
Vitamin A
Vit. A
Vitamin E
Vit. E
Vitamin B1
Vit. B1
Vitamin B2
Vit. B2
Vitamin B3
Vit. B3
Vitamin B5
Vit. B5
Vitamin B6
Vit. B6
Vitamin B12
Vit. B12
Vitamin K
Vit. K
Folate
Folate
11%
0%
9.7%
0%
34%
36%
21%
7.1%
8.8%
1.3%
0%
3%
All nutrients comparison - raw data values
Nutrient
DV% diff.
Phosphorus
260mg
24mg
34%
Saturated fat
11.105g
3.797g
33%
Folate
92µg
4µg
22%
Fats
24.93g
11g
21%
Vitamin B1
0.39mg
0.134mg
21%
Selenium
10.1µg
18%
Iron
2.53mg
1.21mg
17%
Vitamin E
1.99mg
13%
Starch
25.91g
11%
Vitamin B2
0.301mg
0.158mg
11%
Vitamin B3
2.91mg
1.123mg
11%
Polyunsaturated fat
3.915g
2.198g
11%
Calories
434kcal
237kcal
10%
Monounsaturated fat
8.544g
4.388g
10%
Sodium
477mg
266mg
9%
Vitamin K
9.8µg
8%
Protein
5.31g
1.9g
7%
Manganese
0.333mg
0.182mg
7%
Choline
37.3mg
7%
Copper
0.09mg
0.046mg
5%
Vitamin B5
0.377mg
0.119mg
5%
Vitamin C
0mg
3.2mg
4%
Carbs
47.06g
34g
4%
Cholesterol
10mg
0mg
3%
Calcium
40mg
11mg
3%
Zinc
0.5mg
0.16mg
3%
Vitamin A
4µg
29µg
3%
Magnesium
17mg
7mg
2%
Potassium
134mg
65mg
2%
Vitamin B12
0.06µg
0.01µg
2%
Vitamin B6
0.05mg
0.038mg
1%
Protein per 100 calories
1.2g
0.8g
N/A
Calories per 10 g protein
817kcal
1247kcal
N/A
Weight per 100 calories
23g
42g
N/A
Unsaturated / Saturated Fat ratio
1.1
1.7
N/A
Net carbs
45.36g
32.4g
N/A
Sugar
18.15g
N/A
Fiber
1.7g
1.6g
0%
Tryptophan
0.026mg
0%
Threonine
0.054mg
0%
Isoleucine
0.073mg
0%
Leucine
0.129mg
0%
Lysine
0.07mg
0%
Methionine
0.032mg
0%
Phenylalanine
0.088mg
0%
Valine
0.084mg
0%
Histidine
0.038mg
0%
Omega-3 - DHA
0.001g
N/A
Omega-3 - ALA
0.239g
N/A
Omega-3 - Eicosatrienoic acid
0.001g
N/A
Omega-6 - Gamma-linoleic acid
0.017g
N/A
Omega-6 - Eicosadienoic acid
0.006g
N/A
Omega-6 - Linoleic acid
3.573g
N/A
Macronutrient Comparison
Macronutrient breakdown side-by-side comparison
4
5%
25%
47%
21%
2%
Protein:
5.31 g
Fats:
24.93 g
Carbs:
47.06 g
Water:
20.82 g
Other:
1.88 g
1
2%
11%
34%
52%
Protein:
1.9 g
Fats:
11 g
Carbs:
34 g
Water:
52.2 g
Other:
0.9 g
Contains
more
Protein Protein
+179.5%
Contains
more
Fats Fats
+126.6%
Contains
more
Carbs Carbs
+38.4%
Contains
more
Other Other
+108.9%
Contains
more
Water Water
+150.7%
Fat Type Comparison
Fat type breakdown side-by-side comparison
2
47%
36%
17%
Saturated fat:
Sat. Fat
11.105 g
Monounsaturated fat:
Mono. Fat
8.544 g
Polyunsaturated fat:
Poly. Fat
3.915 g
1
37%
42%
21%
Saturated fat:
Sat. Fat
3.797 g
Monounsaturated fat:
Mono. Fat
4.388 g
Polyunsaturated fat:
Poly. Fat
2.198 g
Contains
more
Mono. Fat Monounsaturated fat
+94.7%
Contains
more
Poly. Fat Polyunsaturated fat
+78.1%
Contains
less
Sat. Fat Saturated fat
-65.8%