Summary of differences between drum fish and cockles Drum fish has more vitamin B1; however, cockles are higher in iron. Cockles cover your daily need for iron, 188% more than drum fish. Drum fish has 8 times more vitamin B1 than cockles. While drum fish has 0.081mg of vitamin B1, cockles have only 0.01mg. These are the specific foods used in this comparison Fish, drum, freshwater, cooked, dry heat and Cockles, raw (Alaska Native) .
Infographic
Mineral Comparison
Mineral comparison score is based on the number of minerals by which one or the other food is richer. The "coverage" charts below show how much of the daily needs can be covered by 300 grams of the food.
8
100 g
300 g
3 oz - 85g 1 fillet - 154g
Magnesium
Magnesium
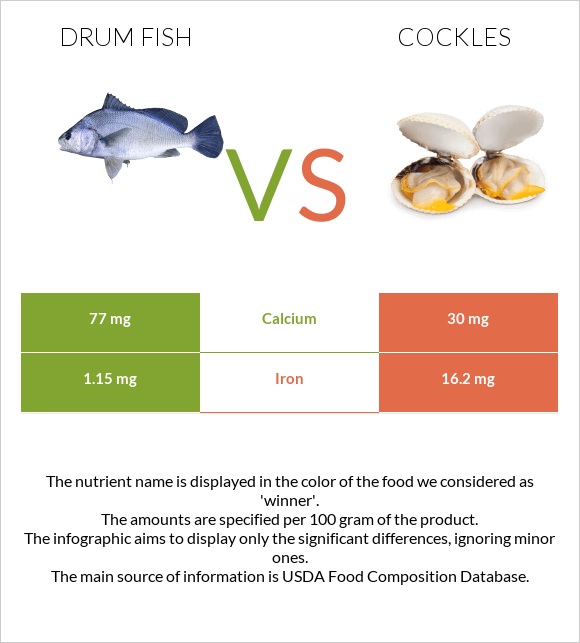
Calcium
Calcium
Potassium
Potassium
Iron
Iron
Copper
Copper
Zinc
Zinc
Phosphorus
Phosphorus
Sodium
Sodium
Manganese
Manganese
Selenium
Selenium
27%
23%
31%
43%
99%
23%
99%
13%
117%
88%
2
100 g
300 g
Magnesium
Magnesium
Calcium
Calcium
Potassium
Potassium
Iron
Iron
Copper
Copper
Zinc
Zinc
Phosphorus
Phosphorus
Sodium
Sodium
Manganese
Manganese
Selenium
Selenium
0%
9%
0%
608%
0%
0%
0%
0%
0%
0%
Vitamin Comparison
Vitamin comparison score is based on the number of vitamins by which one or the other food is richer. The "coverage" charts below show how much of the daily needs can be covered by 300 grams of the food.
7
100 g
300 g
3 oz - 85g 1 fillet - 154g
Vitamin C
Vit. C
Vitamin D
Vit. D
Vitamin A
Vit. A
Vitamin E
Vit. E
Vitamin B1
Vit. B1
Vitamin B2
Vit. B2
Vitamin B3
Vit. B3
Vitamin B5
Vit. B5
Vitamin B6
Vit. B6
Vitamin B12
Vit. B12
Vitamin K
Vit. K
Folate
Folate
3.3%
0%
20%
0%
20%
48%
54%
52%
80%
289%
0%
13%
1
100 g
300 g
Vitamin C
Vit. C
Vitamin D
Vit. D
Vitamin A
Vit. A
Vitamin E
Vit. E
Vitamin B1
Vit. B1
Vitamin B2
Vit. B2
Vitamin B3
Vit. B3
Vitamin B5
Vit. B5
Vitamin B6
Vit. B6
Vitamin B12
Vit. B12
Vitamin K
Vit. K
Folate
Folate
0%
0%
0%
0%
2.5%
46%
60%
0%
0%
0%
0%
0%
All nutrients comparison - raw data values
Nutrient
DV% diff.
Iron
1.15mg
16.2mg
188%
Vitamin B12
2.31µg
96%
Manganese
0.897mg
39%
Copper
0.297mg
33%
Phosphorus
231mg
33%
Selenium
16.2µg
29%
Cholesterol
82mg
27%
Vitamin B6
0.346mg
27%
Protein
22.49g
13.5g
18%
Vitamin B5
0.865mg
17%
Potassium
353mg
10%
Polyunsaturated fat
1.479g
10%
Fats
6.32g
0.7g
9%
Magnesium
38mg
9%
Zinc
0.85mg
8%
Vitamin A
59µg
7%
Saturated fat
1.434g
7%
Monounsaturated fat
2.807g
7%
Vitamin B1
0.081mg
0.01mg
6%
Calcium
77mg
30mg
5%
Calories
153kcal
79kcal
4%
Sodium
96mg
4%
Folate
17µg
4%
Carbs
0g
4.7g
2%
Vitamin B3
2.862mg
3.2mg
2%
Vitamin C
1mg
1%
Vitamin B2
0.207mg
0.2mg
1%
Protein per 100 calories
15g
17g
N/A
Calories per 10 g protein
68kcal
59kcal
N/A
Weight per 100 calories
65g
127g
N/A
Unsaturated / Saturated Fat ratio
3
N/A
Net carbs
0g
4.7g
N/A
Tryptophan
0.252mg
0%
Threonine
0.986mg
0%
Isoleucine
1.036mg
0%
Leucine
1.828mg
0%
Lysine
2.065mg
0%
Methionine
0.666mg
0%
Phenylalanine
0.878mg
0%
Valine
1.159mg
0%
Histidine
0.662mg
0%
Omega-3 - EPA
0.295g
N/A
Omega-3 - DHA
0.368g
N/A
Omega-3 - DPA
0.185g
N/A
Macronutrient Comparison
Macronutrient breakdown side-by-side comparison
2
22%
6%
71%
Protein:
22.49 g
Fats:
6.32 g
Carbs:
0 g
Water:
70.94 g
Other:
0.25 g
3
14%
5%
79%
2%
Protein:
13.5 g
Fats:
0.7 g
Carbs:
4.7 g
Water:
78.8 g
Other:
2.3 g
Contains
more
Protein Protein
+66.6%
Contains
more
Fats Fats
+802.9%
Contains
more
Carbs Carbs
+∞%
Contains
more
Water Water
+11.1%
Contains
more
Other Other
+820%