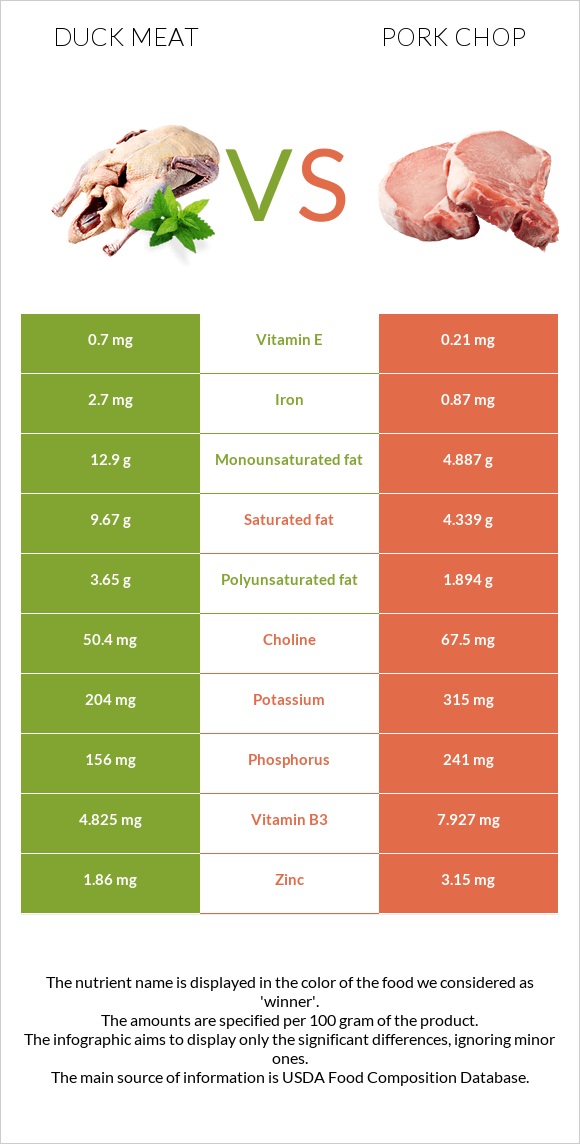
Significant differences between duck meat and pork chop Duck meat is richer in iron and copper, while pork chop is higher in selenium, vitamin B1, vitamin B6, vitamin B3, vitamin B12, phosphorus, and zinc. Pork chop covers your daily selenium needs 30% more than duck meat. Duck meat has 3 times more iron than pork chop. Duck meat has 2.7mg of iron, while pork chop has 0.87mg. Pork chop is lower in saturated fat. Specific food types used in this comparison are Duck, domesticated, meat, and skin, cooked, roasted and Pork, fresh, loin, blade (chops), bone-in, separable lean, and fat, cooked, broiled .
Infographic
Mineral Comparison
Mineral comparison score is based on the number of minerals by which one or the other food is richer. The "coverage" charts below show how much of the daily needs can be covered by 300 grams of the food.
4
100 g
300 g
1 cup, chopped or diced - 140g 1 unit (yield from 1 lb ready-to-cook duck) - 173g 0.5 duck - 382g
Magnesium
Magnesium
Calcium
Calcium
Potassium
Potassium
Iron
Iron
Copper
Copper
Zinc
Zinc
Phosphorus
Phosphorus
Sodium
Sodium
Manganese
Manganese
Selenium
Selenium
11%
3.3%
18%
101%
76%
51%
67%
7.7%
2.5%
109%
6
100 g
300 g
3 oz - 85g 1 chop - 219g
Magnesium
Magnesium
Calcium
Calcium
Potassium
Potassium
Iron
Iron
Copper
Copper
Zinc
Zinc
Phosphorus
Phosphorus
Sodium
Sodium
Manganese
Manganese
Selenium
Selenium
14%
17%
28%
33%
35%
86%
103%
9.7%
1.3%
199%
Vitamin Comparison
Vitamin comparison score is based on the number of vitamins by which one or the other food is richer. The "coverage" charts below show how much of the daily needs can be covered by 300 grams of the food.
4
100 g
300 g
1 cup, chopped or diced - 140g 1 unit (yield from 1 lb ready-to-cook duck) - 173g 0.5 duck - 382g
Vitamin C
Vit. C
Vitamin D
Vit. D
Vitamin A
Vit. A
Vitamin E
Vit. E
Vitamin B1
Vit. B1
Vitamin B2
Vit. B2
Vitamin B3
Vit. B3
Vitamin B5
Vit. B5
Vitamin B6
Vit. B6
Vitamin B12
Vit. B12
Vitamin K
Vit. K
Folate
Folate
0%
1.5%
21%
14%
44%
62%
90%
66%
42%
38%
13%
4.5%
6
100 g
300 g
3 oz - 85g 1 chop - 219g
Vitamin C
Vit. C
Vitamin D
Vit. D
Vitamin A
Vit. A
Vitamin E
Vit. E
Vitamin B1
Vit. B1
Vitamin B2
Vit. B2
Vitamin B3
Vit. B3
Vitamin B5
Vit. B5
Vitamin B6
Vit. B6
Vitamin B12
Vit. B12
Vitamin K
Vit. K
Folate
Folate
0%
15%
1.3%
4.2%
123%
72%
149%
66%
113%
83%
0%
0%
All nutrients comparison - raw data values
Nutrient
DV% diff.
Selenium
20µg
36.4µg
30%
Vitamin B1
0.174mg
0.49mg
26%
Vitamin B6
0.18mg
0.489mg
24%
Saturated fat
9.67g
4.339g
24%
Iron
2.7mg
0.87mg
23%
Fats
28.35g
14.35g
22%
Monounsaturated fat
12.9g
4.887g
20%
Vitamin B3
4.825mg
7.927mg
19%
Vitamin B12
0.3µg
0.66µg
15%
Copper
0.227mg
0.105mg
14%
Zinc
1.86mg
3.15mg
12%
Phosphorus
156mg
241mg
12%
Polyunsaturated fat
3.65g
1.894g
12%
Protein
18.99g
23.72g
9%
Vitamin A
63µg
4µg
7%
Calories
337kcal
231kcal
5%
Vitamin D*
3 IU
40 IU
5%
Vitamin D
0.1µg
1µg
5%
Calcium
11mg
56mg
5%
Vitamin K
5.1µg
0µg
4%
Potassium
204mg
315mg
3%
Vitamin E
0.7mg
0.21mg
3%
Vitamin B2
0.269mg
0.313mg
3%
Choline
50.4mg
67.5mg
3%
Cholesterol
84mg
78mg
2%
Folate
6µg
0µg
2%
Magnesium
16mg
20mg
1%
Sodium
59mg
74mg
1%
Protein per 100 calories
5.6g
10g
N/A
Calories per 10 g protein
177kcal
97kcal
N/A
Weight per 100 calories
30g
43g
N/A
Unsaturated / Saturated Fat ratio
1.7
1.6
N/A
Manganese
0.019mg
0.01mg
0%
Vitamin B5
1.098mg
1.104mg
0%
Trans fat
0.066g
N/A
Tryptophan
0.232mg
0.282mg
0%
Threonine
0.773mg
1.043mg
0%
Isoleucine
0.872mg
1.123mg
0%
Leucine
1.465mg
1.952mg
0%
Lysine
1.486mg
2.109mg
0%
Methionine
0.475mg
0.65mg
0%
Phenylalanine
0.752mg
0.985mg
0%
Valine
0.938mg
1.2mg
0%
Histidine
0.462mg
0.965mg
0%
Omega-3 - DHA
0g
0.001g
N/A
Omega-3 - ALA
0.065g
N/A
Omega-3 - DPA
0g
0.011g
N/A
Omega-6 - Gamma-linoleic acid
0.003g
N/A
Omega-6 - Eicosadienoic acid
0.065g
N/A
Omega-6 - Linoleic acid
0.922g
N/A
Macronutrient Comparison
Macronutrient breakdown side-by-side comparison
2
19%
28%
52%
Protein:
18.99 g
Fats:
28.35 g
Carbs:
0 g
Water:
51.84 g
Other:
0.82 g
2
24%
14%
61%
Protein:
23.72 g
Fats:
14.35 g
Carbs:
0 g
Water:
61.45 g
Other:
0.48 g
Contains
more
Fats Fats
+97.6%
Contains
more
Other Other
+70.8%
Contains
more
Protein Protein
+24.9%
Contains
more
Water Water
+18.5%
Fat Type Comparison
Fat type breakdown side-by-side comparison
2
37%
49%
14%
Saturated fat:
Sat. Fat
9.67 g
Monounsaturated fat:
Mono. Fat
12.9 g
Polyunsaturated fat:
Poly. Fat
3.65 g
1
39%
44%
17%
Saturated fat:
Sat. Fat
4.339 g
Monounsaturated fat:
Mono. Fat
4.887 g
Polyunsaturated fat:
Poly. Fat
1.894 g
Contains
more
Mono. Fat Monounsaturated fat
+164%
Contains
more
Poly. Fat Polyunsaturated fat
+92.7%
Contains
less
Sat. Fat Saturated fat
-55.1%