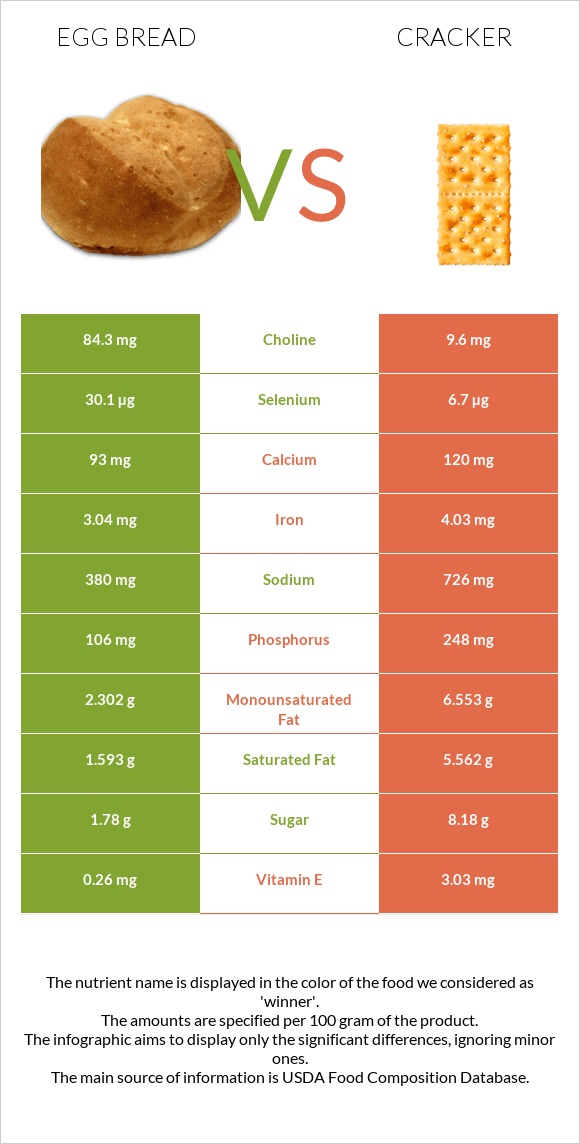
What are the main differences between egg bread and crackers? Egg bread is richer in selenium, choline, and copper, while crackers are higher in vitamin K, phosphorus, vitamin E, and iron. Crackers' daily need coverage for vitamin K is 57% higher. We used Bread, egg and Crackers, standard snack-type, regular types in this comparison.
Infographic
Mineral Comparison
Mineral comparison score is based on the number of minerals by which one or the other food is richer. The "coverage" charts below show how much of the daily needs can be covered by 300 grams of the food.
4
100 g
300 g
1 oz - 28.35g 1 slice (5" x 3" x 1/2") - 40g
Magnesium
Magnesium
Calcium
Calcium
Potassium
Potassium
Iron
Iron
Copper
Copper
Zinc
Zinc
Phosphorus
Phosphorus
Sodium
Sodium
Manganese
Manganese
Selenium
Selenium
14%
28%
10%
114%
54%
22%
45%
50%
65%
164%
3
100 g
300 g
1 cracker, round - 3.2g 1 cracker, rectangular - 4g 5 crackers - 16g 5 crackers, regular size, round (1 serving) - 16g 1 cup crushed - 52g
Magnesium
Magnesium
Calcium
Calcium
Potassium
Potassium
Iron
Iron
Copper
Copper
Zinc
Zinc
Phosphorus
Phosphorus
Sodium
Sodium
Manganese
Manganese
Selenium
Selenium
13%
36%
10%
151%
35%
13%
106%
95%
64%
37%
Vitamin Comparison
Vitamin comparison score is based on the number of vitamins by which one or the other food is richer. The "coverage" charts below show how much of the daily needs can be covered by 300 grams of the food.
5
100 g
300 g
1 oz - 28.35g 1 slice (5" x 3" x 1/2") - 40g
Vitamin C
Vit. C
Vitamin D
Vit. D
Vitamin A
Vit. A
Vitamin E
Vit. E
Vitamin B1
Vit. B1
Vitamin B2
Vit. B2
Vitamin B3
Vit. B3
Vitamin B5
Vit. B5
Vitamin B6
Vit. B6
Vitamin B12
Vit. B12
Vitamin K
Vit. K
Folate
Folate
0%
6%
21%
5.2%
110%
101%
91%
17%
15%
13%
2.3%
79%
3
100 g
300 g
1 cracker, round - 3.2g 1 cracker, rectangular - 4g 5 crackers - 16g 5 crackers, regular size, round (1 serving) - 16g 1 cup crushed - 52g
Vitamin C
Vit. C
Vitamin D
Vit. D
Vitamin A
Vit. A
Vitamin E
Vit. E
Vitamin B1
Vit. B1
Vitamin B2
Vit. B2
Vitamin B3
Vit. B3
Vitamin B5
Vit. B5
Vitamin B6
Vit. B6
Vitamin B12
Vit. B12
Vitamin K
Vit. K
Folate
Folate
0%
0%
0%
61%
104%
105%
82%
25%
15%
0%
173%
69%
All nutrients comparison - raw data values
Nutrient
DV% diff.
Polyunsaturated fat
1.106g
13.137g
80%
Vitamin K
0.9µg
69.3µg
57%
Selenium
30.1µg
6.7µg
43%
Fats
6g
26.43g
31%
Starch
49.69g
20%
Phosphorus
106mg
248mg
20%
Vitamin E
0.26mg
3.03mg
18%
Saturated fat
1.593g
5.562g
18%
Cholesterol
51mg
0mg
17%
Sodium
380mg
726mg
15%
Choline
84.3mg
9.6mg
14%
Iron
3.04mg
4.03mg
12%
Calories
287kcal
510kcal
11%
Monounsaturated fat
2.302g
6.553g
11%
Vitamin A
63µg
0µg
7%
Protein
9.5g
6.64g
6%
Copper
0.162mg
0.104mg
6%
Carbs
47.8g
61.3g
5%
Vitamin B12
0.1µg
0µg
4%
Calcium
93mg
120mg
3%
Zinc
0.79mg
0.49mg
3%
Vitamin B3
4.848mg
4.352mg
3%
Vitamin B5
0.282mg
0.417mg
3%
Folate
105µg
92µg
3%
Vitamin D*
16 IU
0 IU
2%
Vitamin D
0.4µg
0µg
2%
Vitamin B1
0.438mg
0.416mg
2%
Vitamin B2
0.436mg
0.456mg
2%
Protein per 100 calories
3.3g
1.3g
N/A
Calories per 10 g protein
302kcal
768kcal
N/A
Weight per 100 calories
35g
20g
N/A
Unsaturated / Saturated Fat ratio
2.1
3.5
N/A
Net carbs
45.5g
59g
N/A
Magnesium
19mg
18mg
0%
Potassium
115mg
118mg
0%
Sugar
1.78g
8.18g
N/A
Fiber
2.3g
2.3g
0%
Manganese
0.5mg
0.491mg
0%
Vitamin B6
0.064mg
0.063mg
0%
Trans fat
1.076g
N/A
Tryptophan
0.112mg
0.084mg
0%
Threonine
0.306mg
0.193mg
0%
Isoleucine
0.394mg
0.246mg
0%
Leucine
0.692mg
0.471mg
0%
Lysine
0.311mg
0.103mg
0%
Methionine
0.189mg
0.112mg
0%
Phenylalanine
0.475mg
0.331mg
0%
Valine
0.443mg
0.294mg
0%
Histidine
0.21mg
0.145mg
0%
Fructose
0.29g
0%
Omega-3 - EPA
0.001g
0g
N/A
Omega-3 - DHA
0.012g
0g
N/A
Omega-3 - ALA
1.485g
N/A
Omega-6 - Gamma-linoleic acid
0.062g
N/A
Omega-6 - Eicosadienoic acid
0.009g
N/A
Omega-6 - Linoleic acid
11.48g
N/A
Macronutrient Comparison
Macronutrient breakdown side-by-side comparison
2
10%
6%
48%
35%
2%
Protein:
9.5 g
Fats:
6 g
Carbs:
47.8 g
Water:
34.7 g
Other:
2 g
3
7%
26%
61%
3%
2%
Protein:
6.64 g
Fats:
26.43 g
Carbs:
61.3 g
Water:
3.14 g
Other:
2.49 g
Contains
more
Protein Protein
+43.1%
Contains
more
Water Water
+1005.1%
Contains
more
Fats Fats
+340.5%
Contains
more
Carbs Carbs
+28.2%
Contains
more
Other Other
+24.5%
Fat Type Comparison
Fat type breakdown side-by-side comparison
1
32%
46%
22%
Saturated fat:
Sat. Fat
1.593 g
Monounsaturated fat:
Mono. Fat
2.302 g
Polyunsaturated fat:
Poly. Fat
1.106 g
2
22%
26%
52%
Saturated fat:
Sat. Fat
5.562 g
Monounsaturated fat:
Mono. Fat
6.553 g
Polyunsaturated fat:
Poly. Fat
13.137 g
Contains
less
Sat. Fat Saturated fat
-71.4%
Contains
more
Mono. Fat Monounsaturated fat
+184.7%
Contains
more
Poly. Fat Polyunsaturated fat
+1087.8%