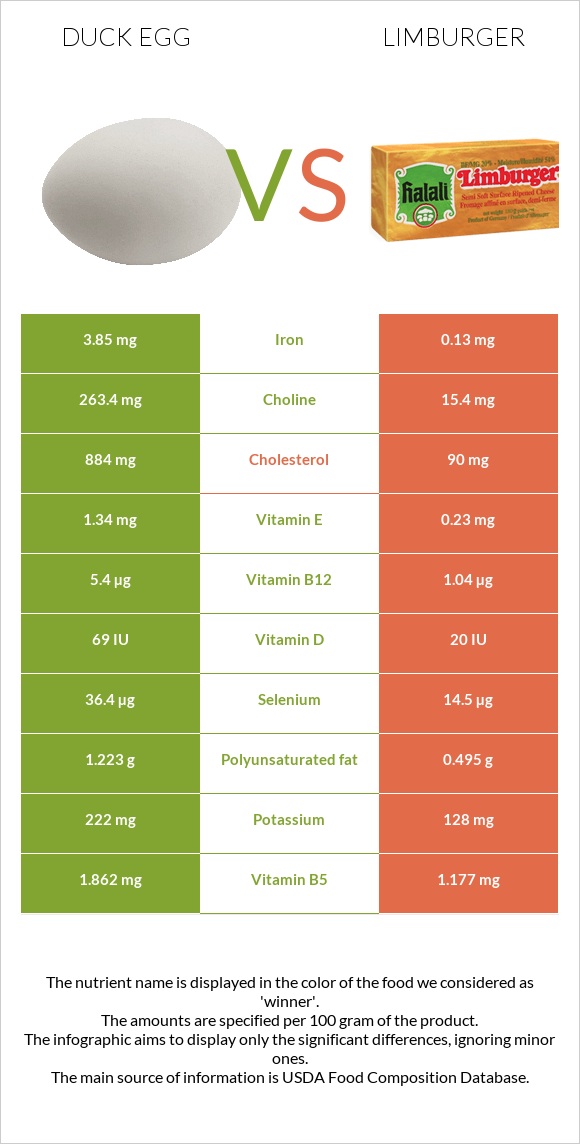
Important differences between duck eggs and Limburger Duck eggs have more vitamin B12, iron, choline, selenium, and vitamin B5; however, Limburger has more calcium and phosphorus. Duck eggs' daily need coverage for cholesterol is 265% more. Duck eggs have 30 times more iron than Limburger. Duck eggs have 3.85mg of iron, while Limburger has 0.13mg. Limburger is lower in cholesterol. The food varieties used in the comparison are Egg, duck, whole, fresh, raw and Cheese, limburger .
Infographic
Mineral Comparison
Mineral comparison score is based on the number of minerals by which one or the other food is richer. The "coverage" charts below show how much of the daily needs can be covered by 300 grams of the food.
5
100 g
300 g
1 egg - 70g
Magnesium
Magnesium
Calcium
Calcium
Potassium
Potassium
Iron
Iron
Copper
Copper
Zinc
Zinc
Phosphorus
Phosphorus
Sodium
Sodium
Manganese
Manganese
Selenium
Selenium
12%
19%
20%
144%
21%
38%
94%
19%
5%
199%
4
100 g
300 g
1 cubic inch - 18g 1 oz - 28.35g 1 box - 113g 1 cup - 134g 1 package (8 oz) - 227g
Magnesium
Magnesium
Calcium
Calcium
Potassium
Potassium
Iron
Iron
Copper
Copper
Zinc
Zinc
Phosphorus
Phosphorus
Sodium
Sodium
Manganese
Manganese
Selenium
Selenium
15%
149%
11%
4.9%
7%
57%
168%
104%
5%
79%
Vitamin Comparison
Vitamin comparison score is based on the number of vitamins by which one or the other food is richer. The "coverage" charts below show how much of the daily needs can be covered by 300 grams of the food.
8
100 g
300 g
1 egg - 70g
Vitamin C
Vit. C
Vitamin D
Vit. D
Vitamin A
Vit. A
Vitamin E
Vit. E
Vitamin B1
Vit. B1
Vitamin B2
Vit. B2
Vitamin B3
Vit. B3
Vitamin B5
Vit. B5
Vitamin B6
Vit. B6
Vitamin B12
Vit. B12
Vitamin K
Vit. K
Folate
Folate
0%
26%
65%
27%
39%
93%
3.8%
112%
58%
675%
1%
60%
3
100 g
300 g
1 cubic inch - 18g 1 oz - 28.35g 1 box - 113g 1 cup - 134g 1 package (8 oz) - 227g
Vitamin C
Vit. C
Vitamin D
Vit. D
Vitamin A
Vit. A
Vitamin E
Vit. E
Vitamin B1
Vit. B1
Vitamin B2
Vit. B2
Vitamin B3
Vit. B3
Vitamin B5
Vit. B5
Vitamin B6
Vit. B6
Vitamin B12
Vit. B12
Vitamin K
Vit. K
Folate
Folate
0%
7.5%
113%
4.6%
20%
116%
3%
71%
20%
130%
5.8%
44%
All nutrients comparison - raw data values
Nutrient
DV% diff.
Cholesterol
884mg
90mg
265%
Vitamin B12
5.4µg
1.04µg
182%
Saturated fat
3.681g
16.746g
59%
Iron
3.85mg
0.13mg
47%
Choline
263.4mg
15.4mg
45%
Calcium
64mg
497mg
43%
Selenium
36.4µg
14.5µg
40%
Sodium
146mg
800mg
28%
Phosphorus
220mg
393mg
25%
Fats
13.77g
27.25g
21%
Vitamin A
194µg
340µg
16%
Protein
12.81g
20.05g
14%
Vitamin B5
1.862mg
1.177mg
14%
Vitamin B6
0.25mg
0.086mg
13%
Vitamin B2
0.404mg
0.503mg
8%
Calories
185kcal
327kcal
7%
Vitamin E
1.34mg
0.23mg
7%
Vitamin D*
69 IU
20 IU
6%
Vitamin D
1.7µg
0.5µg
6%
Zinc
1.41mg
2.1mg
6%
Vitamin B1
0.156mg
0.08mg
6%
Folate
80µg
58µg
6%
Copper
0.062mg
0.021mg
5%
Monounsaturated fat
6.525g
8.606g
5%
Polyunsaturated fat
1.223g
0.495g
5%
Potassium
222mg
128mg
3%
Vitamin K
0.4µg
2.3µg
2%
Magnesium
17mg
21mg
1%
Protein per 100 calories
6.9g
6.1g
N/A
Calories per 10 g protein
144kcal
163kcal
N/A
Weight per 100 calories
54g
31g
N/A
Unsaturated / Saturated Fat ratio
2.1
0.54
N/A
Net carbs
1.45g
0.49g
N/A
Carbs
1.45g
0.49g
0%
Sugar
0.93g
0.49g
N/A
Manganese
0.038mg
0.038mg
0%
Vitamin B3
0.2mg
0.158mg
0%
Tryptophan
0.26mg
0.289mg
0%
Threonine
0.736mg
0.739mg
0%
Isoleucine
0.598mg
1.219mg
0%
Leucine
1.097mg
2.093mg
0%
Lysine
0.951mg
1.675mg
0%
Methionine
0.576mg
0.619mg
0%
Phenylalanine
0.84mg
1.116mg
0%
Valine
0.885mg
1.439mg
0%
Histidine
0.32mg
0.578mg
0%
Macronutrient Comparison
Macronutrient breakdown side-by-side comparison
2
13%
14%
71%
Protein:
12.81 g
Fats:
13.77 g
Carbs:
1.45 g
Water:
70.83 g
Other:
1.14 g
3
20%
27%
48%
4%
Protein:
20.05 g
Fats:
27.25 g
Carbs:
0.49 g
Water:
48.42 g
Other:
3.79 g
Contains
more
Carbs Carbs
+195.9%
Contains
more
Water Water
+46.3%
Contains
more
Protein Protein
+56.5%
Contains
more
Fats Fats
+97.9%
Contains
more
Other Other
+232.5%
Fat Type Comparison
Fat type breakdown side-by-side comparison
2
32%
57%
11%
Saturated fat:
Sat. Fat
3.681 g
Monounsaturated fat:
Mono. Fat
6.525 g
Polyunsaturated fat:
Poly. Fat
1.223 g
1
65%
33%
2%
Saturated fat:
Sat. Fat
16.746 g
Monounsaturated fat:
Mono. Fat
8.606 g
Polyunsaturated fat:
Poly. Fat
0.495 g
Contains
less
Sat. Fat Saturated fat
-78%
Contains
more
Poly. Fat Polyunsaturated fat
+147.1%
Contains
more
Mono. Fat Monounsaturated fat
+31.9%