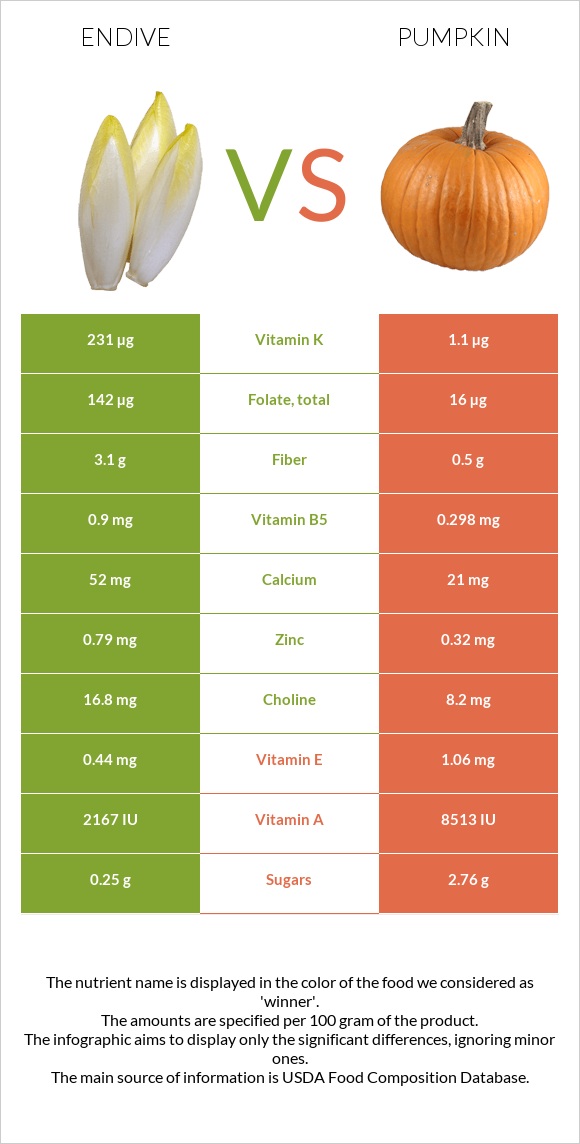
What are the main differences between endive and pumpkins? Endive is richer in vitamin K, folate, manganese, vitamin B5, fiber, and zinc, yet pumpkins are richer in vitamin A. Endive's daily need coverage for vitamin K is 192% higher. Endive has 16 times more folate than pumpkins. Endive has 142µg of folate, while pumpkins have 9µg. We used Endive, raw and Pumpkin, cooked, boiled, drained, without salt types in this comparison.
Infographic
Mineral Comparison
Mineral comparison score is based on the number of minerals by which one or the other food is richer. The "coverage" charts below show how much of the daily needs can be covered by 300 grams of the food.
6
100 g
300 g
0.5 cup, chopped - 25g 1 head - 513g
Magnesium
Magnesium
Calcium
Calcium
Potassium
Potassium
Iron
Iron
Copper
Copper
Zinc
Zinc
Phosphorus
Phosphorus
Sodium
Sodium
Manganese
Manganese
Selenium
Selenium
11%
16%
28%
31%
33%
22%
12%
2.9%
55%
1.1%
1
100 g
300 g
1 cup, mashed - 245g
Magnesium
Magnesium
Calcium
Calcium
Potassium
Potassium
Iron
Iron
Copper
Copper
Zinc
Zinc
Phosphorus
Phosphorus
Sodium
Sodium
Manganese
Manganese
Selenium
Selenium
6.4%
4.5%
20%
21%
30%
6.3%
13%
0.13%
12%
1.1%
Vitamin Comparison
Vitamin comparison score is based on the number of vitamins by which one or the other food is richer. The "coverage" charts below show how much of the daily needs can be covered by 300 grams of the food.
5
100 g
300 g
0.5 cup, chopped - 25g 1 head - 513g
Vitamin C
Vit. C
Vitamin D
Vit. D
Vitamin A
Vit. A
Vitamin E
Vit. E
Vitamin B1
Vit. B1
Vitamin B2
Vit. B2
Vitamin B3
Vit. B3
Vitamin B5
Vit. B5
Vitamin B6
Vit. B6
Vitamin B12
Vit. B12
Vitamin K
Vit. K
Folate
Folate
22%
0%
36%
8.8%
20%
17%
7.5%
54%
4.6%
0%
578%
107%
3
100 g
300 g
1 cup, mashed - 245g
Vitamin C
Vit. C
Vitamin D
Vit. D
Vitamin A
Vit. A
Vitamin E
Vit. E
Vitamin B1
Vit. B1
Vitamin B2
Vit. B2
Vitamin B3
Vit. B3
Vitamin B5
Vit. B5
Vitamin B6
Vit. B6
Vitamin B12
Vit. B12
Vitamin K
Vit. K
Folate
Folate
16%
0%
96%
16%
7.8%
18%
7.7%
12%
10%
0%
2%
6.8%
All nutrients comparison - raw data values
Nutrient
DV% diff.
Vitamin K
231µg
0.8µg
192%
Folate
142µg
9µg
33%
Vitamin A
108µg
288µg
20%
Manganese
0.42mg
0.089mg
14%
Vitamin B5
0.9mg
0.201mg
14%
Fiber
3.1g
1.1g
8%
Zinc
0.79mg
0.23mg
5%
Calcium
52mg
15mg
4%
Vitamin B1
0.08mg
0.031mg
4%
Iron
0.83mg
0.57mg
3%
Vitamin C
6.5mg
4.7mg
2%
Potassium
314mg
230mg
2%
Vitamin E
0.44mg
0.8mg
2%
Vitamin B6
0.02mg
0.044mg
2%
Choline
16.8mg
6.2mg
2%
Protein
1.25g
0.72g
1%
Carbs
3.35g
4.9g
1%
Magnesium
15mg
9mg
1%
Copper
0.099mg
0.091mg
1%
Sodium
22mg
1mg
1%
Polyunsaturated fat
0.087g
0.004g
1%
Calories
17kcal
20kcal
0%
Protein per 100 calories
7.4g
3.6g
N/A
Calories per 10 g protein
136kcal
278kcal
N/A
Weight per 100 calories
588g
500g
N/A
Fats
0.2g
0.07g
0%
Net carbs
0.25g
3.8g
N/A
Sugar
0.25g
2.08g
N/A
Phosphorus
28mg
30mg
0%
Selenium
0.2µg
0.2µg
0%
Vitamin B2
0.075mg
0.078mg
0%
Vitamin B3
0.4mg
0.413mg
0%
Saturated fat
0.048g
0.037g
0%
Monounsaturated fat
0.004g
0.009g
0%
Tryptophan
0.005mg
0.009mg
0%
Threonine
0.05mg
0.021mg
0%
Isoleucine
0.072mg
0.023mg
0%
Leucine
0.098mg
0.034mg
0%
Lysine
0.063mg
0.039mg
0%
Methionine
0.014mg
0.008mg
0%
Phenylalanine
0.053mg
0.023mg
0%
Valine
0.063mg
0.025mg
0%
Histidine
0.023mg
0.011mg
0%
Macronutrient Comparison
Macronutrient breakdown side-by-side comparison
4
3%
94%
Protein:
1.25 g
Fats:
0.2 g
Carbs:
3.35 g
Water:
93.79 g
Other:
1.41 g
1
5%
94%
Protein:
0.72 g
Fats:
0.07 g
Carbs:
4.9 g
Water:
93.69 g
Other:
0.62 g
Contains
more
Protein Protein
+73.6%
Contains
more
Fats Fats
+185.7%
Contains
more
Other Other
+127.4%
Contains
more
Carbs Carbs
+46.3%
Fat Type Comparison
Fat type breakdown side-by-side comparison
1
35%
3%
63%
Saturated fat:
Sat. Fat
0.048 g
Monounsaturated fat:
Mono. Fat
0.004 g
Polyunsaturated fat:
Poly. Fat
0.087 g
2
74%
18%
8%
Saturated fat:
Sat. Fat
0.037 g
Monounsaturated fat:
Mono. Fat
0.009 g
Polyunsaturated fat:
Poly. Fat
0.004 g
Contains
more
Poly. Fat Polyunsaturated fat
+2075%
Contains
less
Sat. Fat Saturated fat
-22.9%
Contains
more
Mono. Fat Monounsaturated fat
+125%