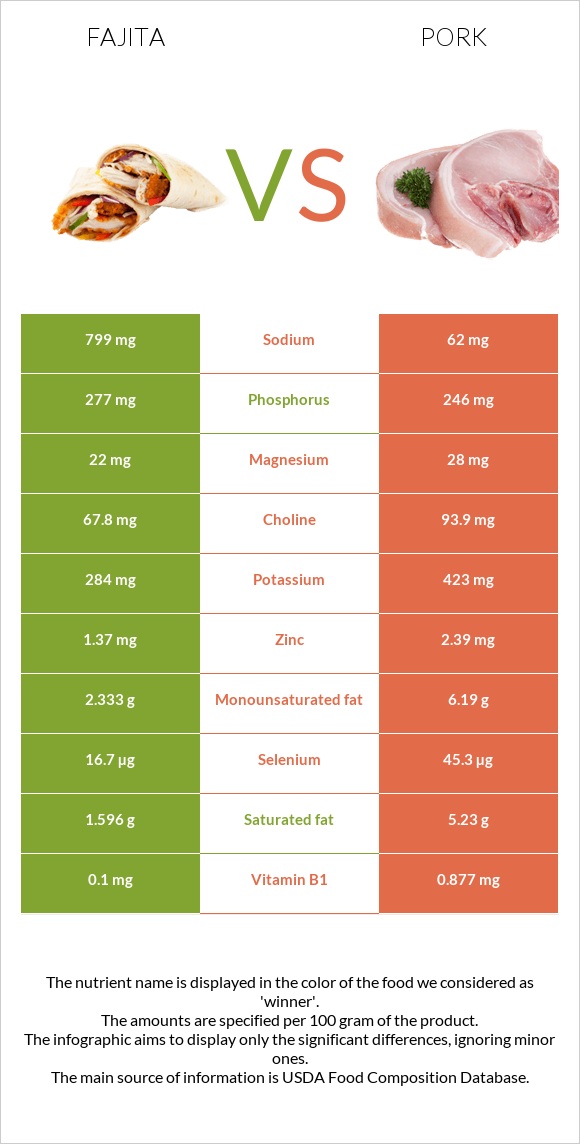
A recap on the differences between fajita and pork Fajita has less vitamin B1, selenium, zinc, vitamin B2, vitamin B12, and vitamin B6. Pork covers your daily vitamin B1 needs 65% more than fajita. Pork contains 13 times less sodium than fajita. Fajita contains 799mg of sodium, while pork contains 62mg. The glycemic index of fajita is higher. Food varieties used in this article are USDA Commodity, chicken fajita strips, frozen and Pork, fresh, loin, whole, separable lean, and fat, cooked, broiled .
Infographic
Mineral Comparison
Mineral comparison score is based on the number of minerals by which one or the other food is richer. The "coverage" charts below show how much of the daily needs can be covered by 300 grams of the food.
3
100 g
300 g
1 strip - 9.4g
Magnesium
Magnesium
Calcium
Calcium
Potassium
Potassium
Iron
Iron
Copper
Copper
Zinc
Zinc
Phosphorus
Phosphorus
Sodium
Sodium
Manganese
Manganese
Selenium
Selenium
16%
3.9%
25%
37%
10%
37%
119%
104%
8.6%
91%
7
100 g
300 g
3 oz - 85g 1 chop, excluding refuse (yield from 1 raw chop, with refuse, weighing 151 g) - 87g
Magnesium
Magnesium
Calcium
Calcium
Potassium
Potassium
Iron
Iron
Copper
Copper
Zinc
Zinc
Phosphorus
Phosphorus
Sodium
Sodium
Manganese
Manganese
Selenium
Selenium
20%
5.7%
37%
33%
24%
65%
105%
8.1%
1.2%
247%
Vitamin Comparison
Vitamin comparison score is based on the number of vitamins by which one or the other food is richer. The "coverage" charts below show how much of the daily needs can be covered by 300 grams of the food.
1
100 g
300 g
1 strip - 9.4g
Vitamin C
Vit. C
Vitamin D
Vit. D
Vitamin A
Vit. A
Vitamin E
Vit. E
Vitamin B1
Vit. B1
Vitamin B2
Vit. B2
Vitamin B3
Vit. B3
Vitamin B5
Vit. B5
Vitamin B6
Vit. B6
Vitamin B12
Vit. B12
Vitamin K
Vit. K
Folate
Folate
0%
0%
0%
4.4%
25%
49%
90%
44%
89%
68%
0.5%
3%
9
100 g
300 g
3 oz - 85g 1 chop, excluding refuse (yield from 1 raw chop, with refuse, weighing 151 g) - 87g
Vitamin C
Vit. C
Vitamin D
Vit. D
Vitamin A
Vit. A
Vitamin E
Vit. E
Vitamin B1
Vit. B1
Vitamin B2
Vit. B2
Vitamin B3
Vit. B3
Vitamin B5
Vit. B5
Vitamin B6
Vit. B6
Vitamin B12
Vit. B12
Vitamin K
Vit. K
Folate
Folate
2%
20%
0.67%
5.8%
219%
74%
94%
42%
107%
88%
0%
3.8%
All nutrients comparison - raw data values
Nutrient
DV% diff.
Vitamin B1
0.1mg
0.877mg
65%
Selenium
16.7µg
45.3µg
52%
Sodium
799mg
62mg
32%
Protein
18.56g
27.32g
18%
Saturated fat
1.596g
5.23g
17%
Fats
5.73g
13.92g
13%
Monounsaturated fat
2.333g
6.19g
10%
Zinc
1.37mg
2.39mg
9%
Vitamin B2
0.213mg
0.321mg
8%
Vitamin D*
53 IU
7%
Vitamin D
1.3µg
7%
Vitamin B12
0.54µg
0.7µg
7%
Vitamin B6
0.387mg
0.464mg
6%
Calories
135kcal
242kcal
5%
Copper
0.03mg
0.073mg
5%
Choline
67.8mg
93.9mg
5%
Potassium
284mg
423mg
4%
Phosphorus
277mg
246mg
4%
Cholesterol
88mg
80mg
3%
Iron
0.99mg
0.87mg
2%
Manganese
0.066mg
0.009mg
2%
Vitamin B3
4.779mg
5.037mg
2%
Vitamin C
0mg
0.6mg
1%
Carbs
2.23g
0g
1%
Magnesium
22mg
28mg
1%
Calcium
13mg
19mg
1%
Vitamin B5
0.726mg
0.698mg
1%
Polyunsaturated fat
1.089g
1.2g
1%
Protein per 100 calories
14g
11g
N/A
Calories per 10 g protein
73kcal
89kcal
N/A
Weight per 100 calories
74g
41g
N/A
Unsaturated / Saturated Fat ratio
2.1
1.4
N/A
Net carbs
2.23g
0g
N/A
Vitamin A
0µg
2µg
0%
Vitamin E
0.22mg
0.29mg
0%
Vitamin K
0.2µg
0µg
0%
Folate
4µg
5µg
0%
Tryptophan
0.2mg
0.338mg
0%
Threonine
0.452mg
1.234mg
0%
Isoleucine
0.813mg
1.26mg
0%
Leucine
1.56mg
2.177mg
0%
Lysine
1.857mg
2.446mg
0%
Methionine
0.552mg
0.712mg
0%
Phenylalanine
0.763mg
1.086mg
0%
Valine
0.847mg
1.473mg
0%
Histidine
0.68mg
1.067mg
0%
Omega-3 - DPA
0.007g
0g
N/A
Omega-6 - Eicosadienoic acid
0.01g
N/A
Macronutrient Comparison
Macronutrient breakdown side-by-side comparison
3
19%
6%
2%
71%
3%
Protein:
18.56 g
Fats:
5.73 g
Carbs:
2.23 g
Water:
70.6 g
Other:
2.88 g
2
27%
14%
58%
Protein:
27.32 g
Fats:
13.92 g
Carbs:
0 g
Water:
57.87 g
Other:
0.89 g
Contains
more
Carbs Carbs
+∞%
Contains
more
Water Water
+22%
Contains
more
Other Other
+223.6%
Contains
more
Protein Protein
+47.2%
Contains
more
Fats Fats
+142.9%
Fat Type Comparison
Fat type breakdown side-by-side comparison
1
32%
46%
22%
Saturated fat:
Sat. Fat
1.596 g
Monounsaturated fat:
Mono. Fat
2.333 g
Polyunsaturated fat:
Poly. Fat
1.089 g
2
41%
49%
10%
Saturated fat:
Sat. Fat
5.23 g
Monounsaturated fat:
Mono. Fat
6.19 g
Polyunsaturated fat:
Poly. Fat
1.2 g
Contains
less
Sat. Fat Saturated fat
-69.5%
Contains
more
Mono. Fat Monounsaturated fat
+165.3%
Contains
more
Poly. Fat Polyunsaturated fat
+10.2%