Fast food vs. Rose hips — In-Depth Nutrition Comparison
Compare
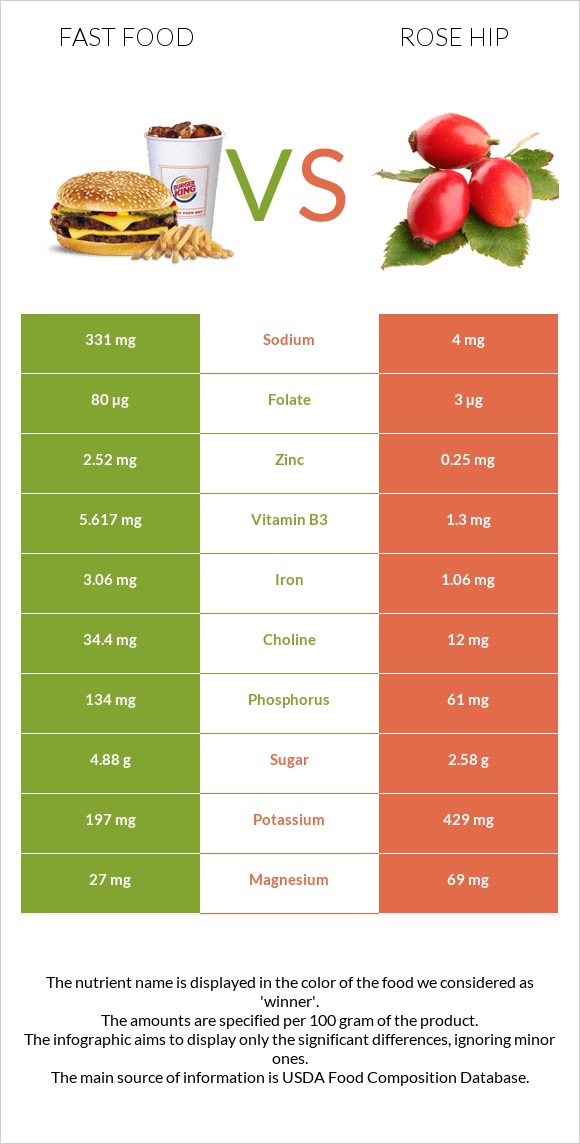
Significant differences between fast food and rose hips
- Fast food has more vitamin B3, vitamin B1, iron, zinc, and folate; however, rose hips are richer in vitamin C, fiber, vitamin A, vitamin E, and manganese.
- Rose hips cover your daily vitamin C needs 473% more than fast food.
- Rose hips have 27 times less folate than fast food. Fast food has 80µg of folate, while rose hips have 3µg.
Specific food types used in this comparison are Fast foods, hamburger; single, regular patty; plain and Rose Hips, wild (Northern Plains Indians).
Infographic
Infographic link
Mineral Comparison
Mineral comparison score is based on the number of minerals by which one or the other food is richer. The "coverage" charts below show how much of the daily needs can be covered by 300 grams of the food.
| Contains more IronIron | +188.7% |
| Contains more ZincZinc | +908% |
| Contains more PhosphorusPhosphorus | +119.7% |
| Contains more SeleniumSelenium | +∞% |
| Contains more MagnesiumMagnesium | +155.6% |
| Contains more CalciumCalcium | +172.6% |
| Contains more PotassiumPotassium | +117.8% |
| Contains less SodiumSodium | -98.8% |
| Contains more ManganeseManganese | +185.7% |
Vitamin Comparison
Vitamin comparison score is based on the number of vitamins by which one or the other food is richer. The "coverage" charts below show how much of the daily needs can be covered by 300 grams of the food.
| Contains more Vitamin DVitamin D | +∞% |
| Contains more Vitamin B1Vitamin B1 | +1881.3% |
| Contains more Vitamin B2Vitamin B2 | +118.7% |
| Contains more Vitamin B3Vitamin B3 | +332.1% |
| Contains more Vitamin B6Vitamin B6 | +178.9% |
| Contains more Vitamin B12Vitamin B12 | +∞% |
| Contains more FolateFolate | +2566.7% |
| Contains more Vitamin CVitamin C | +∞% |
| Contains more Vitamin AVitamin A | +2311.1% |
| Contains more Vitamin EVitamin E | +1436.8% |
| Contains more Vitamin B5Vitamin B5 | +50.9% |
| Contains more Vitamin KVitamin K | +428.6% |
All nutrients comparison - raw data values
| Nutrient |  |
 |
DV% diff. |
| Vitamin C | 0mg | 426mg | 473% |
| Fiber | 1.7g | 24.1g | 90% |
| Selenium | 20.3µg | 37% | |
| Vitamin B12 | 0.89µg | 37% | |
| Vitamin E | 0.38mg | 5.84mg | 36% |
| Protein | 16.52g | 1.6g | 30% |
| Manganese | 0.357mg | 1.02mg | 29% |
| Vitamin B3 | 5.617mg | 1.3mg | 27% |
| Iron | 3.06mg | 1.06mg | 25% |
| Vitamin B1 | 0.317mg | 0.016mg | 25% |
| Vitamin A | 9µg | 217µg | 23% |
| Zinc | 2.52mg | 0.25mg | 21% |
| Saturated fat | 4.493g | 20% | |
| Folate | 80µg | 3µg | 19% |
| Fats | 12.01g | 0.34g | 18% |
| Vitamin K | 4.9µg | 25.9µg | 18% |
| Vitamin B2 | 0.363mg | 0.166mg | 15% |
| Sodium | 331mg | 4mg | 14% |
| Monounsaturated fat | 4.835g | 12% | |
| Cholesterol | 33mg | 11% | |
| Calcium | 62mg | 169mg | 11% |
| Polyunsaturated fat | 1.68g | 11% | |
| Magnesium | 27mg | 69mg | 10% |
| Phosphorus | 134mg | 61mg | 10% |
| Vitamin B6 | 0.212mg | 0.076mg | 10% |
| Starch | 22.87g | 9% | |
| Calories | 297kcal | 162kcal | 7% |
| Potassium | 197mg | 429mg | 7% |
| Vitamin B5 | 0.53mg | 0.8mg | 5% |
| Choline | 34.4mg | 12mg | 4% |
| Carbs | 31.5g | 38.22g | 2% |
| Copper | 0.121mg | 0.113mg | 1% |
| Vitamin D | 0.1µg | 1% | |
| Fructose | 2.27g | 1.16g | 1% |
| Net carbs | 29.8g | 14.12g | N/A |
| Vitamin D | 2 IU | 0% | |
| Sugar | 4.88g | 2.58g | N/A |
| Trans fat | 0.514g | N/A | |
| Tryptophan | 0.144mg | 0% | |
| Threonine | 0.46mg | 0% | |
| Isoleucine | 0.642mg | 0% | |
| Leucine | 1.13mg | 0% | |
| Lysine | 0.785mg | 0% | |
| Methionine | 0.306mg | 0% | |
| Phenylalanine | 0.67mg | 0% | |
| Valine | 0.728mg | 0% | |
| Histidine | 0.402mg | 0% | |
| Omega-3 - EPA | 0.005g | N/A | |
| Omega-3 - DHA | 0.001g | N/A | |
| Omega-3 - ALA | 0.121g | N/A | |
| Omega-3 - DPA | 0.009g | N/A | |
| Omega-6 - Gamma-linoleic acid | 0.004g | N/A | |
| Omega-6 - Dihomo-gamma-linoleic acid | 0.009g | N/A | |
| Omega-6 - Eicosadienoic acid | 0.003g | N/A | |
| Omega-6 - Linoleic acid | 1.391g | N/A |
Macronutrient Comparison
Macronutrient breakdown side-by-side comparison
| Contains more ProteinProtein | +932.5% |
| Contains more FatsFats | +3432.4% |
| Contains more OtherOther | +28.8% |
| Contains more CarbsCarbs | +21.3% |
| Contains more WaterWater | +52.6% |
Carbohydrate type comparison
Carbohydrate type breakdown side-by-side comparison
| Contains more StarchStarch | +∞% |
| Contains more GlucoseGlucose | +53% |
| Contains more FructoseFructose | +95.7% |
| Contains more MaltoseMaltose | +∞% |
| Contains more SucroseSucrose | +∞% |
~equal in
Lactose
~0g
~equal in
Galactose
~0g


