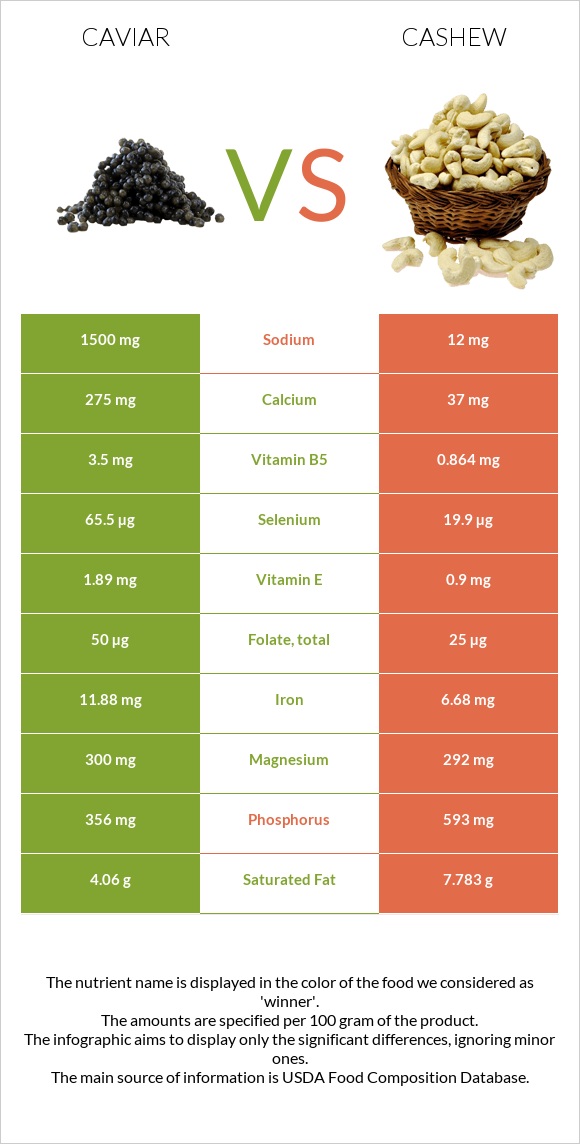
How are caviar and cashew different? Caviar is higher in vitamin B12, selenium, iron, vitamin B5, and vitamin B2; however, cashew is richer in copper, manganese, and zinc. Daily need coverage for vitamin B12 for caviar is 833% higher. Caviar has a lower glycemic index (0) than cashew (25). Fish, caviar, black, and red, granular and Nuts, cashew nuts, raw are the varieties used in this article.
Infographic
Mineral Comparison
Mineral comparison score is based on the number of minerals by which one or the other food is richer. The "coverage" charts below show how much of the daily needs can be covered by 300 grams of the food.
3
100 g
300 g
1 tbsp - 16g 1 oz - 28.35g
Magnesium
Magnesium
Calcium
Calcium
Potassium
Potassium
Iron
Iron
Copper
Copper
Zinc
Zinc
Phosphorus
Phosphorus
Sodium
Sodium
Manganese
Manganese
Selenium
Selenium
214%
83%
16%
446%
37%
26%
153%
196%
6.5%
357%
6
100 g
300 g
1 oz - 28.35g
Magnesium
Magnesium
Calcium
Calcium
Potassium
Potassium
Iron
Iron
Copper
Copper
Zinc
Zinc
Phosphorus
Phosphorus
Sodium
Sodium
Manganese
Manganese
Selenium
Selenium
209%
11%
58%
251%
732%
158%
254%
1.6%
216%
109%
Vitamin Comparison
Vitamin comparison score is based on the number of vitamins by which one or the other food is richer. The "coverage" charts below show how much of the daily needs can be covered by 300 grams of the food.
7
100 g
300 g
1 tbsp - 16g 1 oz - 28.35g
Vitamin C
Vit. C
Vitamin D
Vit. D
Vitamin A
Vit. A
Vitamin E
Vit. E
Vitamin B1
Vit. B1
Vitamin B2
Vit. B2
Vitamin B3
Vit. B3
Vitamin B5
Vit. B5
Vitamin B6
Vit. B6
Vitamin B12
Vit. B12
Vitamin K
Vit. K
Folate
Folate
0%
44%
90%
38%
48%
143%
2.3%
210%
74%
2500%
1.5%
38%
5
100 g
300 g
1 oz - 28.35g
Vitamin C
Vit. C
Vitamin D
Vit. D
Vitamin A
Vit. A
Vitamin E
Vit. E
Vitamin B1
Vit. B1
Vitamin B2
Vit. B2
Vitamin B3
Vit. B3
Vitamin B5
Vit. B5
Vitamin B6
Vit. B6
Vitamin B12
Vit. B12
Vitamin K
Vit. K
Folate
Folate
1.7%
0%
0%
18%
106%
13%
20%
52%
96%
0%
85%
19%
All nutrients comparison - raw data values
Nutrient
DV% diff.
Vitamin B12
20µg
0µg
833%
Copper
0.11mg
2.195mg
232%
Cholesterol
588mg
0mg
196%
Choline
490.9mg
89%
Selenium
65.5µg
19.9µg
83%
Manganese
0.05mg
1.655mg
70%
Iron
11.88mg
6.68mg
65%
Sodium
1500mg
12mg
65%
Vitamin B5
3.5mg
0.864mg
53%
Monounsaturated fat
4.631g
23.797g
48%
Zinc
0.95mg
5.78mg
44%
Vitamin B2
0.62mg
0.058mg
43%
Fats
17.9g
43.85g
40%
Phosphorus
356mg
593mg
34%
Vitamin A
271µg
0µg
30%
Vitamin K
0.6µg
34.1µg
28%
Calcium
275mg
37mg
24%
Vitamin B1
0.19mg
0.423mg
19%
Saturated fat
4.06g
7.783g
17%
Vitamin D*
117 IU
0 IU
15%
Vitamin D
2.9µg
0µg
15%
Calories
264kcal
553kcal
14%
Potassium
181mg
660mg
14%
Protein
24.6g
18.22g
13%
Fiber
0g
3.3g
13%
Starch
23.49g
10%
Carbs
4g
30.19g
9%
Vitamin E
1.89mg
0.9mg
7%
Vitamin B6
0.32mg
0.417mg
7%
Vitamin B3
0.12mg
1.062mg
6%
Folate
50µg
25µg
6%
Polyunsaturated fat
7.405g
7.845g
3%
Magnesium
300mg
292mg
2%
Vitamin C
0mg
0.5mg
1%
Protein per 100 calories
9.3g
3.3g
N/A
Calories per 10 g protein
107kcal
304kcal
N/A
Weight per 100 calories
38g
18g
N/A
Unsaturated / Saturated Fat ratio
3
4.1
N/A
Net carbs
4g
26.89g
N/A
Sugar
0g
5.91g
N/A
Tryptophan
0.323mg
0.287mg
0%
Threonine
1.263mg
0.688mg
0%
Isoleucine
1.035mg
0.789mg
0%
Leucine
2.133mg
1.472mg
0%
Lysine
1.834mg
0.928mg
0%
Methionine
0.646mg
0.362mg
0%
Phenylalanine
1.071mg
0.951mg
0%
Valine
1.263mg
1.094mg
0%
Histidine
0.649mg
0.456mg
0%
Fructose
0.05g
0%
Omega-3 - EPA
2.741g
0g
N/A
Omega-3 - DHA
3.8g
0g
N/A
Omega-3 - DPA
0.229g
0g
N/A
Macronutrient Comparison
Macronutrient breakdown side-by-side comparison
3
25%
18%
4%
48%
6%
Protein:
24.6 g
Fats:
17.9 g
Carbs:
4 g
Water:
47.5 g
Other:
6 g
2
18%
44%
30%
5%
3%
Protein:
18.22 g
Fats:
43.85 g
Carbs:
30.19 g
Water:
5.2 g
Other:
2.54 g
Contains
more
Protein Protein
+35%
Contains
more
Water Water
+813.5%
Contains
more
Other Other
+136.2%
Contains
more
Fats Fats
+145%
Contains
more
Carbs Carbs
+654.8%
Fat Type Comparison
Fat type breakdown side-by-side comparison
1
25%
29%
46%
Saturated fat:
Sat. Fat
4.06 g
Monounsaturated fat:
Mono. Fat
4.631 g
Polyunsaturated fat:
Poly. Fat
7.405 g
2
20%
60%
20%
Saturated fat:
Sat. Fat
7.783 g
Monounsaturated fat:
Mono. Fat
23.797 g
Polyunsaturated fat:
Poly. Fat
7.845 g
Contains
less
Sat. Fat Saturated fat
-47.8%
Contains
more
Mono. Fat Monounsaturated fat
+413.9%
~equal in
Polyunsaturated fat
~7.845g