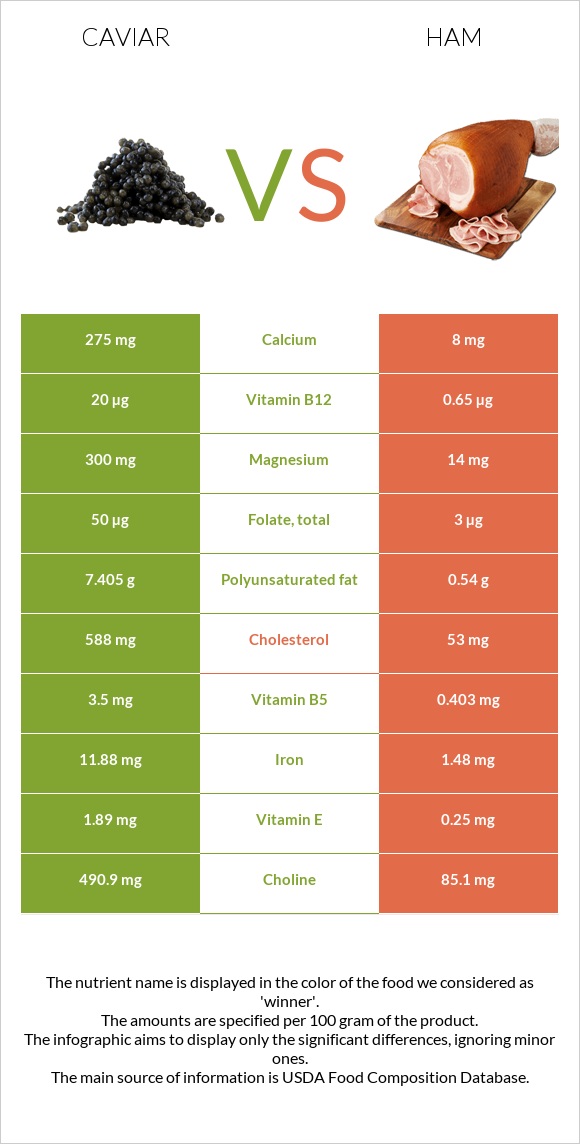
What are the main differences between caviar and ham? Caviar is richer in vitamin B12, iron, selenium, choline, magnesium, vitamin B5, vitamin B2, and calcium, yet ham is richer in vitamin B1. Caviar's daily need coverage for vitamin B12 is 806% higher. Caviar has 34 times more calcium than ham. Caviar has 275mg of calcium, while ham has 8mg. Ham contains less cholesterol. We used Fish, caviar, black, and red, granular and Pork, cured, ham, boneless, extra lean (approximately 5% fat), roasted types in this comparison.
Infographic
Mineral Comparison
Mineral comparison score is based on the number of minerals by which one or the other food is richer. The "coverage" charts below show how much of the daily needs can be covered by 300 grams of the food.
6
100 g
300 g
1 tbsp - 16g 1 oz - 28.35g
Magnesium
Magnesium
Calcium
Calcium
Potassium
Potassium
Iron
Iron
Copper
Copper
Zinc
Zinc
Phosphorus
Phosphorus
Sodium
Sodium
Manganese
Manganese
Selenium
Selenium
214%
83%
16%
446%
37%
26%
153%
196%
6.5%
357%
3
100 g
300 g
3 oz - 85g 1 cup - 140g
Magnesium
Magnesium
Calcium
Calcium
Potassium
Potassium
Iron
Iron
Copper
Copper
Zinc
Zinc
Phosphorus
Phosphorus
Sodium
Sodium
Manganese
Manganese
Selenium
Selenium
10%
2.4%
25%
56%
26%
79%
84%
157%
7%
106%
Vitamin Comparison
Vitamin comparison score is based on the number of vitamins by which one or the other food is richer. The "coverage" charts below show how much of the daily needs can be covered by 300 grams of the food.
8
100 g
300 g
1 tbsp - 16g 1 oz - 28.35g
Vitamin C
Vit. C
Vitamin D
Vit. D
Vitamin A
Vit. A
Vitamin E
Vit. E
Vitamin B1
Vit. B1
Vitamin B2
Vit. B2
Vitamin B3
Vit. B3
Vitamin B5
Vit. B5
Vitamin B6
Vit. B6
Vitamin B12
Vit. B12
Vitamin K
Vit. K
Folate
Folate
0%
44%
90%
38%
48%
143%
2.3%
210%
74%
2500%
1.5%
38%
3
100 g
300 g
3 oz - 85g 1 cup - 140g
Vitamin C
Vit. C
Vitamin D
Vit. D
Vitamin A
Vit. A
Vitamin E
Vit. E
Vitamin B1
Vit. B1
Vitamin B2
Vit. B2
Vitamin B3
Vit. B3
Vitamin B5
Vit. B5
Vitamin B6
Vit. B6
Vitamin B12
Vit. B12
Vitamin K
Vit. K
Folate
Folate
0%
12%
0%
5%
189%
47%
75%
24%
92%
81%
0%
2.3%
All nutrients comparison - raw data values
Nutrient
DV% diff.
Vitamin B12
20µg
0.65µg
806%
Cholesterol
588mg
53mg
178%
Iron
11.88mg
1.48mg
130%
Selenium
65.5µg
19.5µg
84%
Choline
490.9mg
85.1mg
74%
Magnesium
300mg
14mg
68%
Vitamin B5
3.5mg
0.403mg
62%
Vitamin B1
0.19mg
0.754mg
47%
Polyunsaturated fat
7.405g
0.54g
46%
Vitamin B2
0.62mg
0.202mg
32%
Vitamin A
271µg
0µg
30%
Calcium
275mg
8mg
27%
Vitamin B3
0.12mg
4.023mg
24%
Phosphorus
356mg
196mg
23%
Fats
17.9g
5.53g
19%
Zinc
0.95mg
2.88mg
18%
Sodium
1500mg
1203mg
13%
Folate
50µg
3µg
12%
Vitamin D*
117 IU
32 IU
11%
Vitamin D
2.9µg
0.8µg
11%
Vitamin E
1.89mg
0.25mg
11%
Saturated fat
4.06g
1.81g
10%
Protein
24.6g
20.93g
7%
Calories
264kcal
145kcal
6%
Vitamin B6
0.32mg
0.4mg
6%
Monounsaturated fat
4.631g
2.62g
5%
Potassium
181mg
287mg
3%
Copper
0.11mg
0.079mg
3%
Carbs
4g
1.5g
1%
Vitamin K
0.6µg
0µg
1%
Protein per 100 calories
9.3g
14g
N/A
Calories per 10 g protein
107kcal
69kcal
N/A
Weight per 100 calories
38g
69g
N/A
Unsaturated / Saturated Fat ratio
3
1.7
N/A
Net carbs
4g
1.5g
N/A
Manganese
0.05mg
0.054mg
0%
Tryptophan
0.323mg
0.251mg
0%
Threonine
1.263mg
0.931mg
0%
Isoleucine
1.035mg
0.918mg
0%
Leucine
2.133mg
1.661mg
0%
Lysine
1.834mg
1.775mg
0%
Methionine
0.646mg
0.553mg
0%
Phenylalanine
1.071mg
0.904mg
0%
Valine
1.263mg
0.908mg
0%
Histidine
0.649mg
0.75mg
0%
Omega-3 - EPA
2.741g
0g
N/A
Omega-3 - DHA
3.8g
0g
N/A
Omega-3 - DPA
0.229g
0g
N/A
Macronutrient Comparison
Macronutrient breakdown side-by-side comparison
4
25%
18%
4%
48%
6%
Protein:
24.6 g
Fats:
17.9 g
Carbs:
4 g
Water:
47.5 g
Other:
6 g
1
21%
6%
68%
4%
Protein:
20.93 g
Fats:
5.53 g
Carbs:
1.5 g
Water:
67.67 g
Other:
4.37 g
Contains
more
Protein Protein
+17.5%
Contains
more
Fats Fats
+223.7%
Contains
more
Carbs Carbs
+166.7%
Contains
more
Other Other
+37.3%
Contains
more
Water Water
+42.5%
Fat Type Comparison
Fat type breakdown side-by-side comparison
2
25%
29%
46%
Saturated fat:
Sat. Fat
4.06 g
Monounsaturated fat:
Mono. Fat
4.631 g
Polyunsaturated fat:
Poly. Fat
7.405 g
1
36%
53%
11%
Saturated fat:
Sat. Fat
1.81 g
Monounsaturated fat:
Mono. Fat
2.62 g
Polyunsaturated fat:
Poly. Fat
0.54 g
Contains
more
Mono. Fat Monounsaturated fat
+76.8%
Contains
more
Poly. Fat Polyunsaturated fat
+1271.3%
Contains
less
Sat. Fat Saturated fat
-55.4%