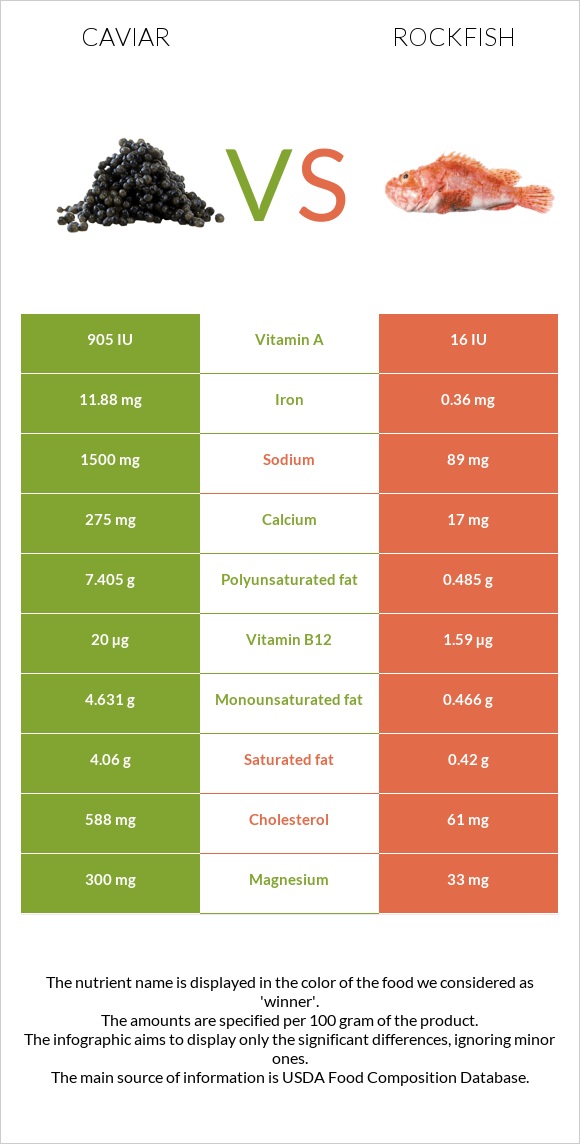
Summary of differences between caviar and rockfish Caviar has more vitamin B12, iron, choline, magnesium, vitamin B5, vitamin B2, and calcium, while rockfish has more selenium. Caviar covers your daily need for vitamin B12, 767% more than rockfish. Caviar contains 33 times more iron than rockfish. While caviar contains 11.88mg of iron, rockfish contains only 0.36mg. The amount of sodium in rockfish is lower. These are the specific foods used in this comparison Fish, caviar, black, and red, granular and Fish, rockfish, Pacific, mixed species, cooked, dry heat .
Infographic
Mineral Comparison
Mineral comparison score is based on the number of minerals by which one or the other food is richer. The "coverage" charts below show how much of the daily needs can be covered by 300 grams of the food.
7
100 g
300 g
1 tbsp - 16g 1 oz - 28.35g
Magnesium
Magnesium
Calcium
Calcium
Potassium
Potassium
Iron
Iron
Copper
Copper
Zinc
Zinc
Phosphorus
Phosphorus
Sodium
Sodium
Manganese
Manganese
Selenium
Selenium
214%
83%
16%
446%
37%
26%
153%
196%
6.5%
357%
3
100 g
300 g
3 oz - 85g 1 fillet - 149g
Magnesium
Magnesium
Calcium
Calcium
Potassium
Potassium
Iron
Iron
Copper
Copper
Zinc
Zinc
Phosphorus
Phosphorus
Sodium
Sodium
Manganese
Manganese
Selenium
Selenium
24%
5.1%
41%
14%
14%
12%
106%
12%
1.7%
416%
Vitamin Comparison
Vitamin comparison score is based on the number of vitamins by which one or the other food is richer. The "coverage" charts below show how much of the daily needs can be covered by 300 grams of the food.
9
100 g
300 g
1 tbsp - 16g 1 oz - 28.35g
Vitamin C
Vit. C
Vitamin D
Vit. D
Vitamin A
Vit. A
Vitamin E
Vit. E
Vitamin B1
Vit. B1
Vitamin B2
Vit. B2
Vitamin B3
Vit. B3
Vitamin B5
Vit. B5
Vitamin B6
Vit. B6
Vitamin B12
Vit. B12
Vitamin K
Vit. K
Folate
Folate
0%
44%
90%
38%
48%
143%
2.3%
210%
74%
2500%
1.5%
38%
2
100 g
300 g
3 oz - 85g 1 fillet - 149g
Vitamin C
Vit. C
Vitamin D
Vit. D
Vitamin A
Vit. A
Vitamin E
Vit. E
Vitamin B1
Vit. B1
Vitamin B2
Vit. B2
Vitamin B3
Vit. B3
Vitamin B5
Vit. B5
Vitamin B6
Vit. B6
Vitamin B12
Vit. B12
Vitamin K
Vit. K
Folate
Folate
0%
69%
1.7%
8.8%
6.8%
52%
54%
24%
56%
199%
0%
7.5%
All nutrients comparison - raw data values
Nutrient
DV% diff.
Vitamin B12
20µg
1.59µg
767%
Cholesterol
588mg
61mg
176%
Iron
11.88mg
0.36mg
144%
Choline
490.9mg
78.7mg
75%
Magnesium
300mg
33mg
64%
Vitamin B5
3.5mg
0.404mg
62%
Sodium
1500mg
89mg
61%
Polyunsaturated fat
7.405g
0.485g
46%
Vitamin A
271µg
5µg
30%
Vitamin B2
0.62mg
0.226mg
30%
Calcium
275mg
17mg
26%
Fats
17.9g
1.62g
25%
Selenium
65.5µg
76.2µg
19%
Vitamin B3
0.12mg
2.897mg
17%
Saturated fat
4.06g
0.42g
17%
Phosphorus
356mg
248mg
15%
Vitamin B1
0.19mg
0.027mg
14%
Vitamin E
1.89mg
0.44mg
10%
Folate
50µg
10µg
10%
Monounsaturated fat
4.631g
0.466g
10%
Vitamin D
2.9µg
4.6µg
9%
Calories
264kcal
109kcal
8%
Vitamin D*
117 IU
183 IU
8%
Potassium
181mg
467mg
8%
Copper
0.11mg
0.041mg
8%
Vitamin B6
0.32mg
0.241mg
6%
Protein
24.6g
22.23g
5%
Zinc
0.95mg
0.43mg
5%
Manganese
0.05mg
0.013mg
2%
Carbs
4g
0g
1%
Vitamin K
0.6µg
0µg
1%
Protein per 100 calories
9.3g
20g
N/A
Calories per 10 g protein
107kcal
49kcal
N/A
Weight per 100 calories
38g
92g
N/A
Unsaturated / Saturated Fat ratio
3
2.3
N/A
Net carbs
4g
0g
N/A
Trans fat
0.025g
N/A
Tryptophan
0.323mg
0.296mg
0%
Threonine
1.263mg
1.014mg
0%
Isoleucine
1.035mg
1.06mg
0%
Leucine
2.133mg
1.835mg
0%
Lysine
1.834mg
2.188mg
0%
Methionine
0.646mg
0.707mg
0%
Phenylalanine
1.071mg
0.935mg
0%
Valine
1.263mg
1.106mg
0%
Histidine
0.649mg
0.502mg
0%
Omega-3 - EPA
2.741g
0.107g
N/A
Omega-3 - DHA
3.8g
0.238g
N/A
Omega-3 - DPA
0.229g
0.027g
N/A
Omega-6 - Eicosadienoic acid
0.005g
N/A
Macronutrient Comparison
Macronutrient breakdown side-by-side comparison
4
25%
18%
4%
48%
6%
Protein:
24.6 g
Fats:
17.9 g
Carbs:
4 g
Water:
47.5 g
Other:
6 g
1
22%
75%
Protein:
22.23 g
Fats:
1.62 g
Carbs:
0 g
Water:
74.67 g
Other:
1.48 g
Contains
more
Fats Fats
+1004.9%
Contains
more
Carbs Carbs
+∞%
Contains
more
Other Other
+305.4%
Contains
more
Water Water
+57.2%
~equal in
Protein
~22.23g
Fat Type Comparison
Fat type breakdown side-by-side comparison
2
25%
29%
46%
Saturated fat:
Sat. Fat
4.06 g
Monounsaturated fat:
Mono. Fat
4.631 g
Polyunsaturated fat:
Poly. Fat
7.405 g
1
31%
34%
35%
Saturated fat:
Sat. Fat
0.42 g
Monounsaturated fat:
Mono. Fat
0.466 g
Polyunsaturated fat:
Poly. Fat
0.485 g
Contains
more
Mono. Fat Monounsaturated fat
+893.8%
Contains
more
Poly. Fat Polyunsaturated fat
+1426.8%
Contains
less
Sat. Fat Saturated fat
-89.7%