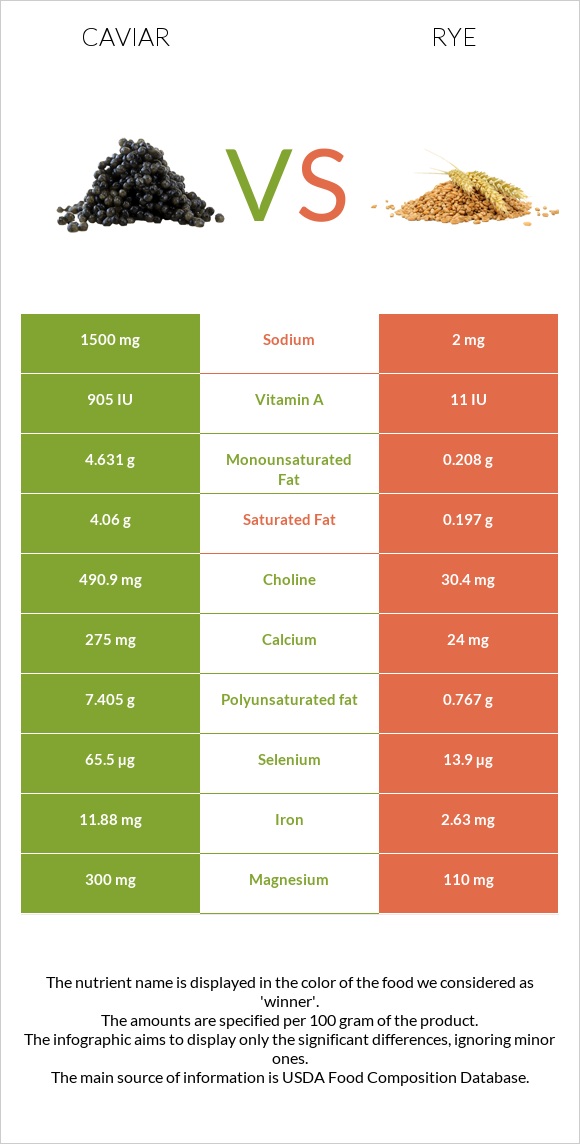
The main differences between caviar and rye Caviar has more vitamin B12, iron, selenium, choline, magnesium, and vitamin B5; however, rye has more manganese and fiber. Daily need coverage for vitamin B12 for caviar is 833% higher. Rye has a higher glycemic index than caviar. Food types used in this article are Fish, caviar, black, and red, granular and Rye grain .
Infographic
Mineral Comparison
Mineral comparison score is based on the number of minerals by which one or the other food is richer. The "coverage" charts below show how much of the daily needs can be covered by 300 grams of the food.
4
100 g
300 g
1 tbsp - 16g 1 oz - 28.35g
Magnesium
Magnesium
Calcium
Calcium
Potassium
Potassium
Iron
Iron
Copper
Copper
Zinc
Zinc
Phosphorus
Phosphorus
Sodium
Sodium
Manganese
Manganese
Selenium
Selenium
214%
83%
16%
446%
37%
26%
153%
196%
6.5%
357%
5
100 g
300 g
1 cup - 169g
Magnesium
Magnesium
Calcium
Calcium
Potassium
Potassium
Iron
Iron
Copper
Copper
Zinc
Zinc
Phosphorus
Phosphorus
Sodium
Sodium
Manganese
Manganese
Selenium
Selenium
79%
7.2%
45%
99%
122%
72%
142%
0.26%
336%
76%
Vitamin Comparison
Vitamin comparison score is based on the number of vitamins by which one or the other food is richer. The "coverage" charts below show how much of the daily needs can be covered by 300 grams of the food.
7
100 g
300 g
1 tbsp - 16g 1 oz - 28.35g
Vitamin C
Vit. C
Vitamin D
Vit. D
Vitamin A
Vit. A
Vitamin E
Vit. E
Vitamin B1
Vit. B1
Vitamin B2
Vit. B2
Vitamin B3
Vit. B3
Vitamin B5
Vit. B5
Vitamin B6
Vit. B6
Vitamin B12
Vit. B12
Vitamin K
Vit. K
Folate
Folate
0%
44%
90%
38%
48%
143%
2.3%
210%
74%
2500%
1.5%
38%
3
100 g
300 g
1 cup - 169g
Vitamin C
Vit. C
Vitamin D
Vit. D
Vitamin A
Vit. A
Vitamin E
Vit. E
Vitamin B1
Vit. B1
Vitamin B2
Vit. B2
Vitamin B3
Vit. B3
Vitamin B5
Vit. B5
Vitamin B6
Vit. B6
Vitamin B12
Vit. B12
Vitamin K
Vit. K
Folate
Folate
0%
0%
0.33%
17%
79%
58%
80%
87%
68%
0%
15%
29%
All nutrients comparison - raw data values
Nutrient
DV% diff.
Vitamin B12
20µg
0µg
833%
Cholesterol
588mg
0mg
196%
Iron
11.88mg
2.63mg
116%
Manganese
0.05mg
2.577mg
110%
Selenium
65.5µg
13.9µg
94%
Choline
490.9mg
30.4mg
84%
Sodium
1500mg
2mg
65%
Fiber
0g
15.1g
60%
Magnesium
300mg
110mg
45%
Polyunsaturated fat
7.405g
0.767g
44%
Vitamin B5
3.5mg
1.456mg
41%
Vitamin A
271µg
1µg
30%
Protein
24.6g
10.34g
29%
Copper
0.11mg
0.367mg
29%
Vitamin B2
0.62mg
0.251mg
28%
Vitamin B3
0.12mg
4.27mg
26%
Fats
17.9g
1.63g
25%
Calcium
275mg
24mg
25%
Carbs
4g
75.86g
24%
Saturated fat
4.06g
0.197g
18%
Vitamin D*
117 IU
0 IU
15%
Vitamin D
2.9µg
0µg
15%
Zinc
0.95mg
2.65mg
15%
Vitamin B1
0.19mg
0.316mg
11%
Monounsaturated fat
4.631g
0.208g
11%
Potassium
181mg
510mg
10%
Vitamin E
1.89mg
0.85mg
7%
Calories
264kcal
338kcal
4%
Vitamin K
0.6µg
5.9µg
4%
Phosphorus
356mg
332mg
3%
Folate
50µg
38µg
3%
Vitamin B6
0.32mg
0.294mg
2%
Protein per 100 calories
9.3g
3.1g
N/A
Calories per 10 g protein
107kcal
327kcal
N/A
Weight per 100 calories
38g
30g
N/A
Unsaturated / Saturated Fat ratio
3
4.9
N/A
Net carbs
4g
60.76g
N/A
Sugar
0g
0.98g
N/A
Tryptophan
0.323mg
0.108mg
0%
Threonine
1.263mg
0.289mg
0%
Isoleucine
1.035mg
0.208mg
0%
Leucine
2.133mg
0.563mg
0%
Lysine
1.834mg
0.286mg
0%
Methionine
0.646mg
0.153mg
0%
Phenylalanine
1.071mg
0.435mg
0%
Valine
1.263mg
0.317mg
0%
Histidine
0.649mg
0.189mg
0%
Fructose
0.11g
0%
Omega-3 - EPA
2.741g
0g
N/A
Omega-3 - DHA
3.8g
0g
N/A
Omega-3 - DPA
0.229g
0g
N/A
Macronutrient Comparison
Macronutrient breakdown side-by-side comparison
4
25%
18%
4%
48%
6%
Protein:
24.6 g
Fats:
17.9 g
Carbs:
4 g
Water:
47.5 g
Other:
6 g
1
10%
76%
11%
Protein:
10.34 g
Fats:
1.63 g
Carbs:
75.86 g
Water:
10.6 g
Other:
1.57 g
Contains
more
Protein Protein
+137.9%
Contains
more
Fats Fats
+998.2%
Contains
more
Water Water
+348.1%
Contains
more
Other Other
+282.2%
Contains
more
Carbs Carbs
+1796.5%
Fat Type Comparison
Fat type breakdown side-by-side comparison
2
25%
29%
46%
Saturated fat:
Sat. Fat
4.06 g
Monounsaturated fat:
Mono. Fat
4.631 g
Polyunsaturated fat:
Poly. Fat
7.405 g
1
17%
18%
65%
Saturated fat:
Sat. Fat
0.197 g
Monounsaturated fat:
Mono. Fat
0.208 g
Polyunsaturated fat:
Poly. Fat
0.767 g
Contains
more
Mono. Fat Monounsaturated fat
+2126.4%
Contains
more
Poly. Fat Polyunsaturated fat
+865.4%
Contains
less
Sat. Fat Saturated fat
-95.1%