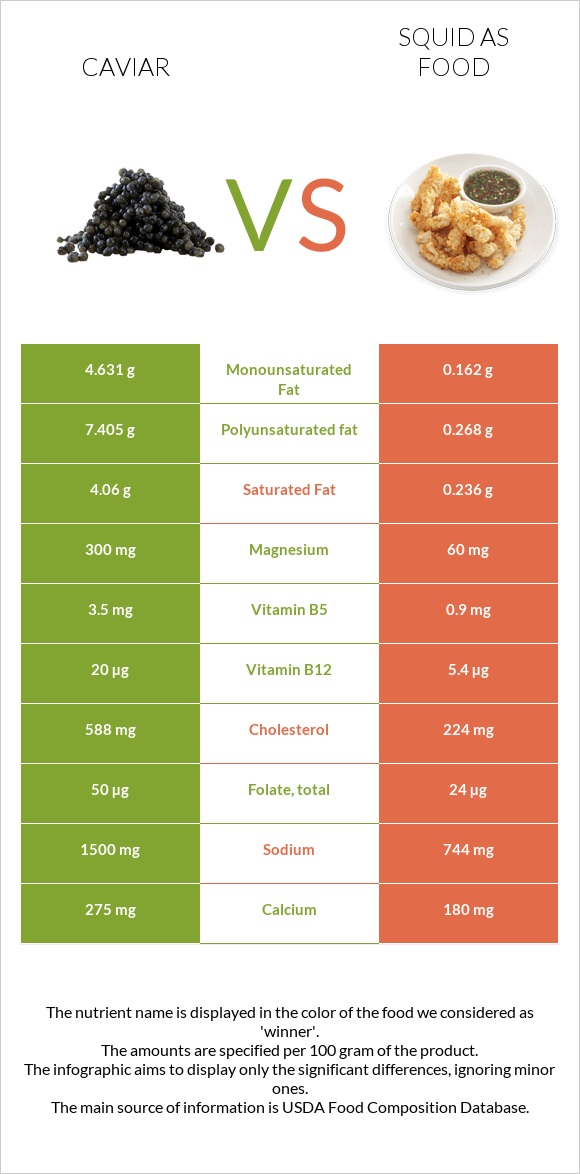
Differences between caviar and squid Caviar has more vitamin B12, magnesium, and vitamin B5, while squid has more copper, vitamin B2, selenium, phosphorus, and zinc. Caviar's daily need coverage for vitamin B12 is 608% higher. Squid contains 5 times less magnesium than caviar. Caviar contains 300mg of magnesium, while squid contains 60mg. The amount of cholesterol in squid is lower. The food types used in this comparison are Fish, caviar, black, and red, granular and Mollusks, cuttlefish, mixed species, cooked, moist heat .
Infographic
Mineral Comparison
Mineral comparison score is based on the number of minerals by which one or the other food is richer. The "coverage" charts below show how much of the daily needs can be covered by 300 grams of the food.
2
100 g
300 g
1 tbsp - 16g 1 oz - 28.35g
Magnesium
Magnesium
Calcium
Calcium
Potassium
Potassium
Iron
Iron
Copper
Copper
Zinc
Zinc
Phosphorus
Phosphorus
Sodium
Sodium
Manganese
Manganese
Selenium
Selenium
214%
83%
16%
446%
37%
26%
153%
196%
6.5%
357%
7
100 g
300 g
3 oz - 85g
Magnesium
Magnesium
Calcium
Calcium
Potassium
Potassium
Iron
Iron
Copper
Copper
Zinc
Zinc
Phosphorus
Phosphorus
Sodium
Sodium
Manganese
Manganese
Selenium
Selenium
43%
54%
56%
407%
333%
94%
249%
97%
27%
489%
Vitamin Comparison
Vitamin comparison score is based on the number of vitamins by which one or the other food is richer. The "coverage" charts below show how much of the daily needs can be covered by 300 grams of the food.
9
100 g
300 g
1 tbsp - 16g 1 oz - 28.35g
Vitamin C
Vit. C
Vitamin D
Vit. D
Vitamin A
Vit. A
Vitamin E
Vit. E
Vitamin B1
Vit. B1
Vitamin B2
Vit. B2
Vitamin B3
Vit. B3
Vitamin B5
Vit. B5
Vitamin B6
Vit. B6
Vitamin B12
Vit. B12
Vitamin K
Vit. K
Folate
Folate
0%
44%
90%
38%
48%
143%
2.3%
210%
74%
2500%
1.5%
38%
3
100 g
300 g
3 oz - 85g
Vitamin C
Vit. C
Vitamin D
Vit. D
Vitamin A
Vit. A
Vitamin E
Vit. E
Vitamin B1
Vit. B1
Vitamin B2
Vit. B2
Vitamin B3
Vit. B3
Vitamin B5
Vit. B5
Vitamin B6
Vit. B6
Vitamin B12
Vit. B12
Vitamin K
Vit. K
Folate
Folate
28%
0%
68%
0%
4.3%
399%
41%
54%
62%
675%
0%
18%
All nutrients comparison - raw data values
Nutrient
DV% diff.
Vitamin B12
20µg
5.4µg
608%
Cholesterol
588mg
224mg
121%
Copper
0.11mg
0.998mg
99%
Choline
490.9mg
89%
Vitamin B2
0.62mg
1.729mg
85%
Magnesium
300mg
60mg
57%
Vitamin B5
3.5mg
0.9mg
52%
Polyunsaturated fat
7.405g
0.268g
48%
Selenium
65.5µg
89.6µg
44%
Sodium
1500mg
744mg
33%
Phosphorus
356mg
580mg
32%
Fats
17.9g
1.4g
25%
Zinc
0.95mg
3.46mg
23%
Saturated fat
4.06g
0.236g
17%
Protein
24.6g
32.48g
16%
Vitamin D*
117 IU
15%
Vitamin D
2.9µg
15%
Vitamin B1
0.19mg
0.017mg
14%
Potassium
181mg
637mg
13%
Iron
11.88mg
10.84mg
13%
Vitamin E
1.89mg
13%
Vitamin B3
0.12mg
2.189mg
13%
Monounsaturated fat
4.631g
0.162g
11%
Calcium
275mg
180mg
10%
Vitamin C
0mg
8.5mg
9%
Vitamin A
271µg
203µg
8%
Manganese
0.05mg
0.209mg
7%
Folate
50µg
24µg
7%
Calories
264kcal
158kcal
5%
Vitamin B6
0.32mg
0.27mg
4%
Carbs
4g
1.64g
1%
Vitamin K
0.6µg
1%
Protein per 100 calories
9.3g
21g
N/A
Calories per 10 g protein
107kcal
49kcal
N/A
Weight per 100 calories
38g
63g
N/A
Unsaturated / Saturated Fat ratio
3
1.8
N/A
Net carbs
4g
1.64g
N/A
Tryptophan
0.323mg
0.364mg
0%
Threonine
1.263mg
1.398mg
0%
Isoleucine
1.035mg
1.414mg
0%
Leucine
2.133mg
2.287mg
0%
Lysine
1.834mg
2.427mg
0%
Methionine
0.646mg
0.733mg
0%
Phenylalanine
1.071mg
1.164mg
0%
Valine
1.263mg
1.419mg
0%
Histidine
0.649mg
0.624mg
0%
Omega-3 - EPA
2.741g
0.078g
N/A
Omega-3 - DHA
3.8g
0.132g
N/A
Omega-3 - DPA
0.229g
0.012g
N/A
Macronutrient Comparison
Macronutrient breakdown side-by-side comparison
3
25%
18%
4%
48%
6%
Protein:
24.6 g
Fats:
17.9 g
Carbs:
4 g
Water:
47.5 g
Other:
6 g
2
32%
61%
3%
Protein:
32.48 g
Fats:
1.4 g
Carbs:
1.64 g
Water:
61.12 g
Other:
3.36 g
Contains
more
Fats Fats
+1178.6%
Contains
more
Carbs Carbs
+143.9%
Contains
more
Other Other
+78.6%
Contains
more
Protein Protein
+32%
Contains
more
Water Water
+28.7%
Fat Type Comparison
Fat type breakdown side-by-side comparison
2
25%
29%
46%
Saturated fat:
Sat. Fat
4.06 g
Monounsaturated fat:
Mono. Fat
4.631 g
Polyunsaturated fat:
Poly. Fat
7.405 g
1
35%
24%
40%
Saturated fat:
Sat. Fat
0.236 g
Monounsaturated fat:
Mono. Fat
0.162 g
Polyunsaturated fat:
Poly. Fat
0.268 g
Contains
more
Mono. Fat Monounsaturated fat
+2758.6%
Contains
more
Poly. Fat Polyunsaturated fat
+2663.1%
Contains
less
Sat. Fat Saturated fat
-94.2%