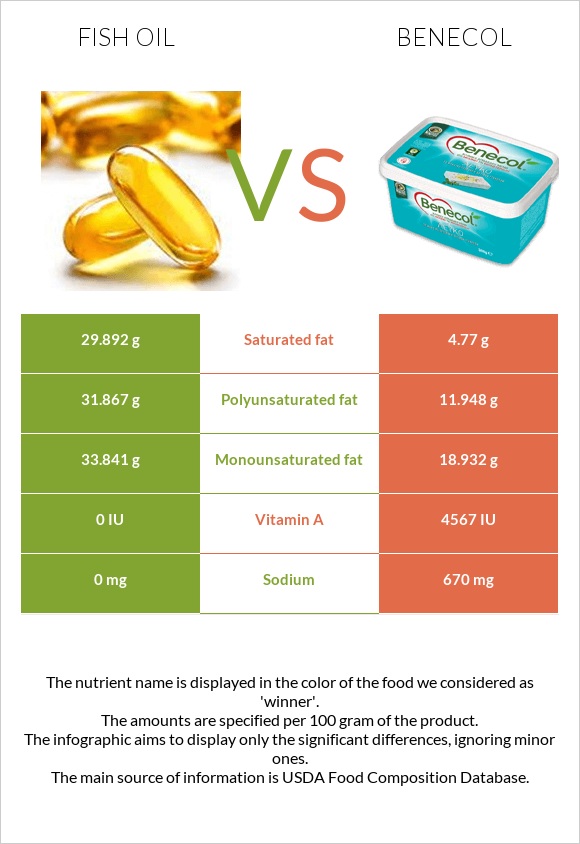
Differences between fish oil and benecol Fish oil has more monounsaturated fat and polyunsaturated fat, while benecol has more vitamin A. Fish oil's daily need coverage for saturated fat is 126% higher. Benecol contains 3 times less polyunsaturated fat than fish oil. Fish oil contains 31.867g of polyunsaturated fat, while benecol contains 11.948g. The amount of saturated fat in benecol is lower. The food types used in this comparison are Fish oil, sardine and Margarine-like spread, BENECOL Light Spread .
Infographic
Mineral Comparison
Mineral comparison score is based on the number of minerals by which one or the other food is richer. The "coverage" charts below show how much of the daily needs can be covered by 300 grams of the food.
1
100 g
300 g
1 tsp - 4.5g 1 tbsp - 13.6g 1 cup - 218g
Magnesium
Magnesium
Calcium
Calcium
Potassium
Potassium
Iron
Iron
Copper
Copper
Zinc
Zinc
Phosphorus
Phosphorus
Sodium
Sodium
Manganese
Manganese
Selenium
Selenium
0%
0%
0%
0%
0%
0%
0%
0%
0%
0%
4
100 g
300 g
1 tablespoon (1 NLEA serving) - 14g
Magnesium
Magnesium
Calcium
Calcium
Potassium
Potassium
Iron
Iron
Copper
Copper
Zinc
Zinc
Phosphorus
Phosphorus
Sodium
Sodium
Manganese
Manganese
Selenium
Selenium
0.71%
1.2%
0.35%
0%
0%
0%
1.7%
87%
0%
0%
Vitamin Comparison
Vitamin comparison score is based on the number of vitamins by which one or the other food is richer. The "coverage" charts below show how much of the daily needs can be covered by 300 grams of the food.
1
100 g
300 g
1 tsp - 4.5g 1 tbsp - 13.6g 1 cup - 218g
Vitamin C
Vit. C
Vitamin D
Vit. D
Vitamin A
Vit. A
Vitamin E
Vit. E
Vitamin B1
Vit. B1
Vitamin B2
Vit. B2
Vitamin B3
Vit. B3
Vitamin B5
Vit. B5
Vitamin B6
Vit. B6
Vitamin B12
Vit. B12
Vitamin K
Vit. K
Folate
Folate
0%
125%
0%
0%
0%
0%
0%
0%
0%
0%
0%
0%
4
100 g
300 g
1 tablespoon (1 NLEA serving) - 14g
Vitamin C
Vit. C
Vitamin D
Vit. D
Vitamin A
Vit. A
Vitamin E
Vit. E
Vitamin B1
Vit. B1
Vitamin B2
Vit. B2
Vitamin B3
Vit. B3
Vitamin B5
Vit. B5
Vitamin B6
Vit. B6
Vitamin B12
Vit. B12
Vitamin K
Vit. K
Folate
Folate
0%
0%
457%
744%
3%
0%
0%
0%
0%
0%
141%
0%
All nutrients comparison - raw data values
Nutrient
DV% diff.
Vitamin E
37.22mg
248%
Cholesterol
710mg
237%
Vitamin A
0µg
1370µg
152%
Polyunsaturated fat
31.867g
11.948g
133%
Saturated fat
29.892g
4.77g
114%
Fats
100g
38.71g
94%
Vitamin K
56.5µg
47%
Vitamin D*
332 IU
42%
Vitamin D
8.3µg
42%
Monounsaturated fat
33.841g
18.932g
37%
Sodium
0mg
670mg
29%
Calories
902kcal
357kcal
27%
Carbs
0g
5.71g
2%
Phosphorus
0mg
4mg
1%
Vitamin B1
0mg
0.012mg
1%
Weight per 100 calories
11g
28g
N/A
Unsaturated / Saturated Fat ratio
2.2
6.5
N/A
Net carbs
0g
5.71g
N/A
Magnesium
0mg
1mg
0%
Calcium
0mg
4mg
0%
Potassium
0mg
4mg
0%
Trans fat
2.214g
N/A
Omega-3 - EPA
10.137g
0g
N/A
Omega-3 - DHA
10.656g
0g
N/A
Omega-3 - ALA
1.976g
N/A
Omega-3 - DPA
1.973g
0g
N/A
Omega-6 - Eicosadienoic acid
0.037g
N/A
Omega-6 - Linoleic acid
9.557g
N/A
Macronutrient Comparison
Macronutrient breakdown side-by-side comparison
1
100%
Protein:
0 g
Fats:
100 g
Carbs:
0 g
Water:
0 g
Other:
0 g
3
39%
6%
54%
2%
Protein:
0 g
Fats:
38.71 g
Carbs:
5.71 g
Water:
53.73 g
Other:
1.85 g
Contains
more
Fats Fats
+158.3%
Contains
more
Carbs Carbs
+∞%
Contains
more
Water Water
+∞%
Contains
more
Other Other
+∞%
Fat Type Comparison
Fat type breakdown side-by-side comparison
2
31%
35%
33%
Saturated fat:
Sat. Fat
29.892 g
Monounsaturated fat:
Mono. Fat
33.841 g
Polyunsaturated fat:
Poly. Fat
31.867 g
1
13%
53%
34%
Saturated fat:
Sat. Fat
4.77 g
Monounsaturated fat:
Mono. Fat
18.932 g
Polyunsaturated fat:
Poly. Fat
11.948 g
Contains
more
Mono. Fat Monounsaturated fat
+78.8%
Contains
more
Poly. Fat Polyunsaturated fat
+166.7%
Contains
less
Sat. Fat Saturated fat
-84%