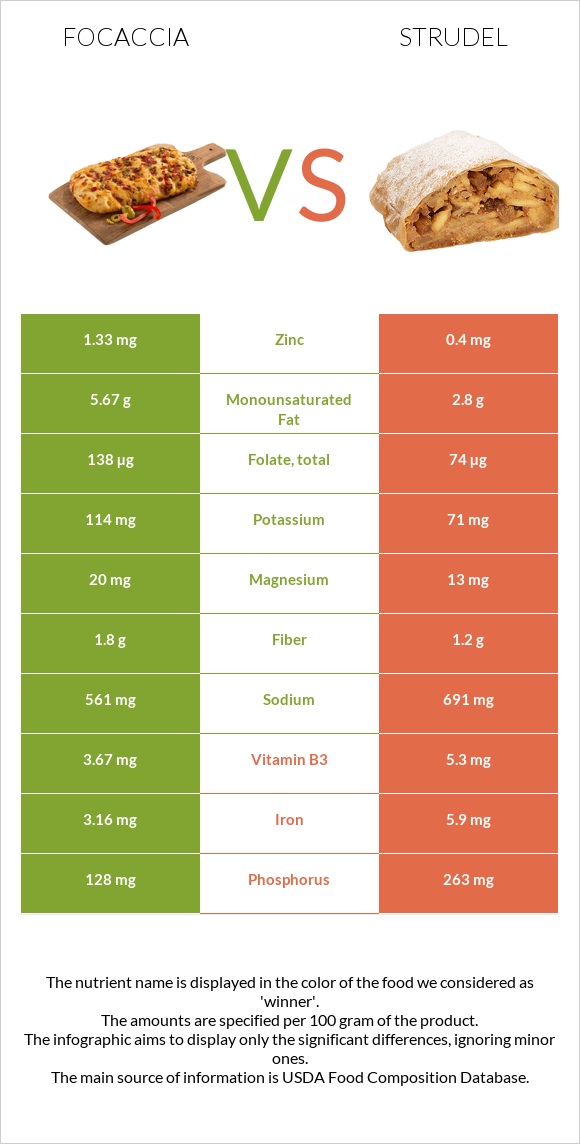
Differences between focaccia and strudel Focaccia has more folate and vitamin E, while strudel has more vitamin B12, iron, vitamin B6, vitamin A, calcium, phosphorus, vitamin B2, and vitamin B3. Strudel's daily need coverage for vitamin B12 is 67% higher. The food types used in this comparison are Focaccia, Italian flatbread, plain and KELLOGG'S, EGGO, Wafflers, Strawberry Strudel .
Infographic
Mineral Comparison
Mineral comparison score is based on the number of minerals by which one or the other food is richer. The "coverage" charts below show how much of the daily needs can be covered by 300 grams of the food.
7
100 g
300 g
1 piece - 57g
Magnesium
Magnesium
Calcium
Calcium
Potassium
Potassium
Iron
Iron
Copper
Copper
Zinc
Zinc
Phosphorus
Phosphorus
Sodium
Sodium
Manganese
Manganese
Selenium
Selenium
14%
11%
10%
119%
30%
36%
55%
73%
47%
87%
3
100 g
300 g
2 waffles - 76g
Magnesium
Magnesium
Calcium
Calcium
Potassium
Potassium
Iron
Iron
Copper
Copper
Zinc
Zinc
Phosphorus
Phosphorus
Sodium
Sodium
Manganese
Manganese
Selenium
Selenium
9.3%
88%
6.3%
221%
0%
11%
113%
90%
0%
0%
Vitamin Comparison
Vitamin comparison score is based on the number of vitamins by which one or the other food is richer. The "coverage" charts below show how much of the daily needs can be covered by 300 grams of the food.
5
100 g
300 g
1 piece - 57g
Vitamin C
Vit. C
Vitamin D
Vit. D
Vitamin A
Vit. A
Vitamin E
Vit. E
Vitamin B1
Vit. B1
Vitamin B2
Vit. B2
Vitamin B3
Vit. B3
Vitamin B5
Vit. B5
Vitamin B6
Vit. B6
Vitamin B12
Vit. B12
Vitamin K
Vit. K
Folate
Folate
0%
0%
0%
28%
118%
69%
69%
39%
26%
0%
14%
104%
5
100 g
300 g
2 waffles - 76g
Vitamin C
Vit. C
Vitamin D
Vit. D
Vitamin A
Vit. A
Vitamin E
Vit. E
Vitamin B1
Vit. B1
Vitamin B2
Vit. B2
Vitamin B3
Vit. B3
Vitamin B5
Vit. B5
Vitamin B6
Vit. B6
Vitamin B12
Vit. B12
Vitamin K
Vit. K
Folate
Folate
0%
0%
132%
0%
98%
104%
99%
0%
122%
200%
0%
56%
All nutrients comparison - raw data values
Nutrient
DV% diff.
Vitamin B12
0µg
1.6µg
67%
Vitamin A
0µg
395µg
44%
Iron
3.16mg
5.9mg
34%
Vitamin B6
0.113mg
0.53mg
32%
Selenium
15.9µg
29%
Calcium
35mg
293mg
26%
Polyunsaturated fat
0.994g
4.6g
24%
Phosphorus
128mg
263mg
19%
Manganese
0.364mg
16%
Folate
138µg
74µg
16%
Vitamin B5
0.645mg
13%
Vitamin B2
0.301mg
0.45mg
11%
Copper
0.091mg
10%
Vitamin B3
3.67mg
5.3mg
10%
Vitamin E
1.42mg
0mg
9%
Protein
8.77g
5g
8%
Zinc
1.33mg
0.4mg
8%
Saturated fat
0.877g
2.7g
8%
Vitamin B1
0.47mg
0.39mg
7%
Monounsaturated fat
5.67g
2.8g
7%
Sodium
561mg
691mg
6%
Fats
7.89g
11g
5%
Carbs
35.82g
50g
5%
Vitamin K
5.7µg
5%
Cholesterol
0mg
12mg
4%
Calories
249kcal
318kcal
3%
Magnesium
20mg
13mg
2%
Fiber
1.8g
1.2g
2%
Potassium
114mg
71mg
1%
Choline
2.9mg
1%
Protein per 100 calories
3.5g
1.6g
N/A
Calories per 10 g protein
284kcal
636kcal
N/A
Weight per 100 calories
40g
31g
N/A
Unsaturated / Saturated Fat ratio
7.6
2.7
N/A
Net carbs
34.02g
48.8g
N/A
Vitamin D*
0 IU
1 IU
0%
Sugar
1.75g
16.8g
N/A
Trans fat
0g
0.2g
N/A
Macronutrient Comparison
Macronutrient breakdown side-by-side comparison
2
9%
8%
36%
46%
Protein:
8.77 g
Fats:
7.89 g
Carbs:
35.82 g
Water:
45.91 g
Other:
1.61 g
3
5%
11%
50%
29%
5%
Protein:
5 g
Fats:
11 g
Carbs:
50 g
Water:
29.2 g
Other:
4.8 g
Contains
more
Protein Protein
+75.4%
Contains
more
Water Water
+57.2%
Contains
more
Fats Fats
+39.4%
Contains
more
Carbs Carbs
+39.6%
Contains
more
Other Other
+198.1%
Fat Type Comparison
Fat type breakdown side-by-side comparison
2
12%
75%
13%
Saturated fat:
Sat. Fat
0.877 g
Monounsaturated fat:
Mono. Fat
5.67 g
Polyunsaturated fat:
Poly. Fat
0.994 g
1
27%
28%
46%
Saturated fat:
Sat. Fat
2.7 g
Monounsaturated fat:
Mono. Fat
2.8 g
Polyunsaturated fat:
Poly. Fat
4.6 g
Contains
less
Sat. Fat Saturated fat
-67.5%
Contains
more
Mono. Fat Monounsaturated fat
+102.5%
Contains
more
Poly. Fat Polyunsaturated fat
+362.8%