Foie Gras vs. Pate — What Is The Difference?


Summary
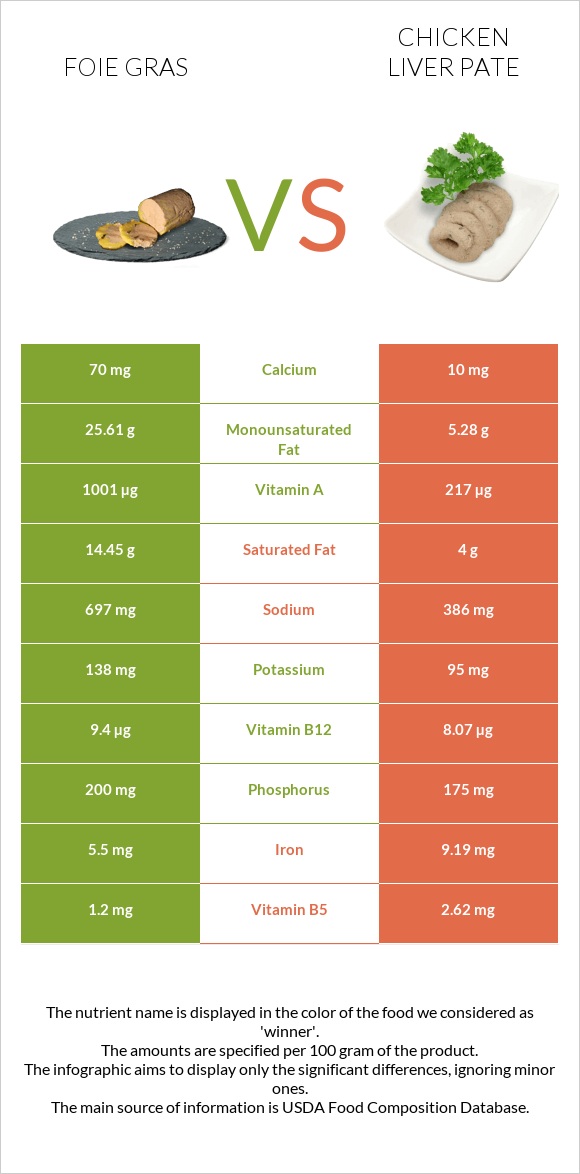
Foie gras is higher in calories, fats, and sodium. It also contains more calcium, potassium, phosphorus, vitamin A, and vitamin B12.
In comparison, pate is richer in zinc, iron, vitamin C, vitamin B5, and folate. Pate is lower in saturated fats, monounsaturated fats, and sodium.
Introduction
This article will compare two animal-derived foods, foie gras and pate. Foie gras is a French word that translates into fatty liver. Foie gras comes from goose liver. In comparison, pate is ground and processed meat; we can find different varieties such as pork, venison, poultry, and beef.
This article will consider chicken liver pate and foie gras.
What's The Difference?
Foie gras, derived from the fattened liver of ducks, can be consumed as a whole piece, as a mousse, or in the form of a pate.
Pate encompasses various types of meat, such as beef, poultry, pork, and fish, combined with herbs, vegetables, and spices. Typically, pate is served with toast or crackers.
Foie gras comes from the liver of a goose. In comparison, pate is a processed meat of pork, beef, poultry, or venison.
Thus, foie gras falls under the category of pate, but it's important to note that not all pate is made from foie gras.
Taste
People often consider foie gras to taste buttery, rich, and smooth. In comparison, chicken liver pate's creamy texture might be grainy, but the flavor is not as rich as foie gras. However, the taste is always personal; some people might like pate more than foie gras.
Nutrition
This section will compare 100g of each foie gras and chicken liver pate.
Calories
Foie gras contains 462 calories, and pate contains 201 calories.
The difference is highly significant. Foie gras contains 2.3 times more calories compared to pate.
Carbs
Pate contains higher amounts of carbs compared to foie gras. The amount of carbs is not very high overall, but a difference does exist between them.
Fats
The fat content is the most significant difference regarding their nutritional content differences.
Since foie gras translates to fatty liver, foie gras is higher in fats than pate.
Foie gras contains 3.4 times more fat compared to pate. Foie gras contains 44g of fat, and in comparison, pate contains 13g of fat.
It is essential to mention the fat categories in this comparison.
Foie gras contains 10g more saturated fats than pate and 20g more monounsaturated fats.
However, pate, although much lower in fats, contains a slightly higher amount of polyunsaturated fats, which has little significance.
Below we can visualize their differences.
Fat Type Comparison
Contains
more
Mono. FatMonounsaturated fat
+385%
Contains
less
Sat. FatSaturated fat
-72.3%
Contains
more
Poly. FatPolyunsaturated fat
+192.9%
Protein
Pate is slightly richer in proteins. The difference is not of high significance. Pate contains 13g of protein, whereas pate contains 11.5g.
Macronutrient Comparison
Contains
more
FatsFats
+234.7%
Contains
more
OtherOther
+142.1%
Contains
more
ProteinProtein
+18%
Contains
more
CarbsCarbs
+40.3%
Contains
more
WaterWater
+77.2%
Minerals
Pate is richer in zinc and iron. It is also lower in sodium.
On the other hand, foie gras is richer in calcium, potassium, and phosphorus.
Mineral Comparison
Contains
more
CalciumCalcium
+600%
Contains
more
PotassiumPotassium
+45.3%
Contains
more
CopperCopper
+122.2%
Contains
more
PhosphorusPhosphorus
+14.3%
Contains
more
IronIron
+67.1%
Contains
more
ZincZinc
+132.6%
Contains
less
SodiumSodium
-44.6%
Contains
more
ManganeseManganese
+35%
Vitamins
Pate is vitamin dense and is richer in vitamins C, E, B2, B5, B6, and folate. In comparison, foie gras is richer in vitamins A and B12.
Vitamin Comparison
Contains
more
Vitamin AVitamin A
+361.3%
Contains
more
Vitamin B1Vitamin B1
+69.2%
Contains
more
Vitamin B12Vitamin B12
+16.5%
Contains
more
Vitamin CVitamin C
+400%
Contains
more
Vitamin B2Vitamin B2
+368.6%
Contains
more
Vitamin B3Vitamin B3
+199.5%
Contains
more
Vitamin B5Vitamin B5
+118.3%
Contains
more
Vitamin B6Vitamin B6
+333.3%
Contains
more
FolateFolate
+435%
Health Impacts
Cancer
Research has shown that processed meat is closely linked to a higher likelihood of developing cancer and has been categorized as a Group 1 carcinogen. This classification indicates substantial evidence that consuming large amounts of processed meat leads to an increased risk of colorectal cancer.
Pate is considered processed meat that is positively associated with cancer(1)
Cardiovascular health
Foie gras ticks most boxes regarding cardiovascular health's negative impacts.
Foie gras is high in sodium, increasing hypertension risks and mortality rates from cardiovascular diseases. (2)
In addition, foie gras contains high saturated fats, which are associated with increased risks of atherosclerosis and cardiovascular diseases, and cardiological guidelines recommend consuming lower amounts of saturated fats. In addition, the focus is on consuming unsaturated fats and considering that foie gras is richer in monounsaturated fats. (3)
However, it is counterintuitive to say eating foie gras is good for your health when it is high in saturated fats and sodium.
Miscellaneous
Although if we consider several aspects, pate is richer in vitamins, which has many benefits for our health. Foie gras is richer in copper, phosphorus, and vitamins B12 and A. However, considering both foods, their cons outweigh their pros. Even comparatively, we can't conclude whether one is healthier.
It is like saying, are cigars healthier than cigarettes?
References

Infographic
All nutrients comparison - raw data values
| Nutrient | |
|
DV% diff. |
| Vitamin A | 1001µg | 217µg | 87% |
| Vitamin B2 | 0.299mg | 1.401mg | 85% |
| Cholesterol | 150mg | 391mg | 80% |
| Folate | 60µg | 321µg | 65% |
| Vitamin B12 | 9.4µg | 8.07µg | 55% |
| Monounsaturated fat | 25.61g | 5.28g | 51% |
| Saturated fat | 14.45g | 4g | 48% |
| Fats | 43.84g | 13.1g | 47% |
| Iron | 5.5mg | 9.19mg | 46% |
| Choline | 228.8mg | 42% | |
| Vitamin B3 | 2.51mg | 7.517mg | 31% |
| Vitamin B5 | 1.2mg | 2.62mg | 28% |
| Copper | 0.4mg | 0.18mg | 24% |
| Vitamin B6 | 0.06mg | 0.26mg | 15% |
| Sodium | 697mg | 386mg | 14% |
| Calories | 462kcal | 201kcal | 13% |
| Zinc | 0.92mg | 2.14mg | 11% |
| Polyunsaturated fat | 0.84g | 2.46g | 11% |
| Vitamin C | 2mg | 10mg | 9% |
| Vitamin E | 0.98mg | 7% | |
| Calcium | 70mg | 10mg | 6% |
| Protein | 11.4g | 13.45g | 4% |
| Phosphorus | 200mg | 175mg | 4% |
| Selenium | 44µg | 46.1µg | 4% |
| Vitamin B1 | 0.088mg | 0.052mg | 3% |
| Manganese | 0.12mg | 0.162mg | 2% |
| Carbs | 4.67g | 6.55g | 1% |
| Potassium | 138mg | 95mg | 1% |
| Protein per 100 calories | 2.5g | 6.7g | N/A |
| Calories per 10 g protein | 405kcal | 149kcal | N/A |
| Weight per 100 calories | 22g | 50g | N/A |
| Unsaturated / Saturated Fat ratio | 1.8 | 1.9 | N/A |
| Net carbs | 4.67g | 6.55g | N/A |
| Magnesium | 13mg | 13mg | 0% |
| Tryptophan | 0.161mg | 0.195mg | 0% |
| Threonine | 0.507mg | 0.601mg | 0% |
| Isoleucine | 0.606mg | 0.735mg | 0% |
| Leucine | 1.029mg | 1.196mg | 0% |
| Lysine | 0.863mg | 0.953mg | 0% |
| Methionine | 0.27mg | 0.34mg | 0% |
| Phenylalanine | 0.567mg | 0.694mg | 0% |
| Valine | 0.719mg | 0.863mg | 0% |
| Histidine | 0.303mg | 0.347mg | 0% |
People also compare


References
All the values for which the sources are not specified explicitly are taken from FDA’s Food Central. The exact link to the food presented on this page can be found below.
- Foie gras - https://fdc.nal.usda.gov/fdc-app.html#/food-details/171100/nutrients
- Chicken liver pate - https://fdc.nal.usda.gov/fdc-app.html#/food-details/172928/nutrients
All the Daily Values are presented for males aged 31-50, for 2000-calorie diets.