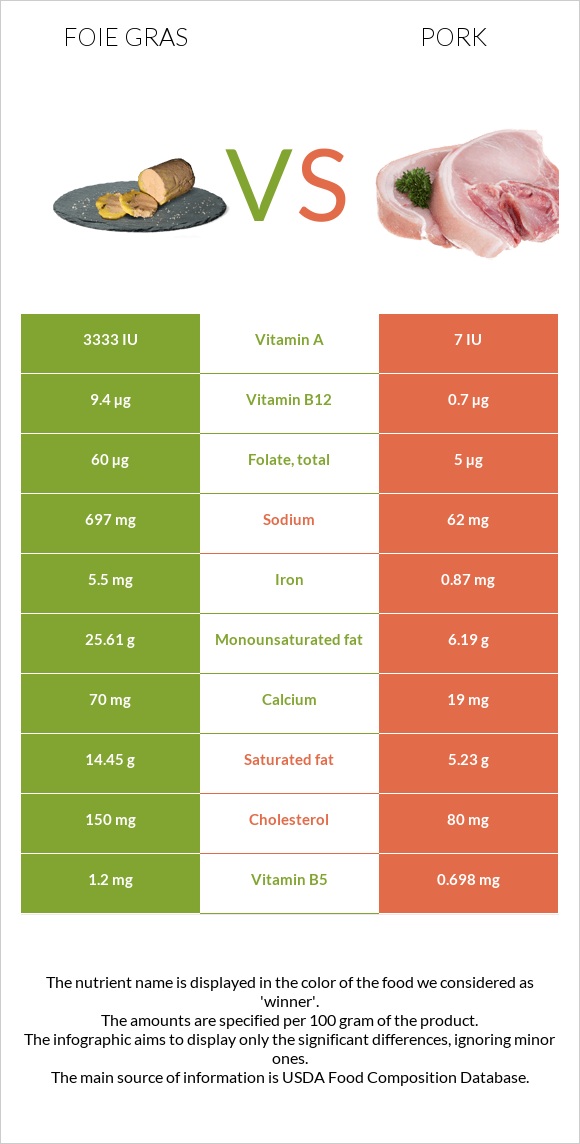
The main differences between foie gras and pork Foie gras has more vitamin B12, vitamin A, iron, and copper; however, pork has more vitamin B1, vitamin B6, and vitamin B3. Daily need coverage for vitamin B12 for foie gras is 363% higher. Pork has 476 times less vitamin A than foie gras. Foie gras has 3333 IU of vitamin A, while pork has 7 IU. Pork is lower in sodium. Food types used in this article are Pate de foie gras, canned (goose liver pate), smoked and Pork, fresh, loin, whole, separable lean, and fat, cooked, broiled .
Infographic
Mineral Comparison
Mineral comparison score is based on the number of minerals by which one or the other food is richer. The "coverage" charts below show how much of the daily needs can be covered by 300 grams of the food.
4
100 g
300 g
1 tbsp - 13g 1 oz - 28.35g
Magnesium
Magnesium
Calcium
Calcium
Potassium
Potassium
Iron
Iron
Copper
Copper
Zinc
Zinc
Phosphorus
Phosphorus
Sodium
Sodium
Manganese
Manganese
Selenium
Selenium
9.3%
21%
12%
206%
133%
25%
86%
91%
16%
240%
5
100 g
300 g
3 oz - 85g 1 chop, excluding refuse (yield from 1 raw chop, with refuse, weighing 151 g) - 87g
Magnesium
Magnesium
Calcium
Calcium
Potassium
Potassium
Iron
Iron
Copper
Copper
Zinc
Zinc
Phosphorus
Phosphorus
Sodium
Sodium
Manganese
Manganese
Selenium
Selenium
20%
5.7%
37%
33%
24%
65%
105%
8.1%
1.2%
247%
Vitamin Comparison
Vitamin comparison score is based on the number of vitamins by which one or the other food is richer. The "coverage" charts below show how much of the daily needs can be covered by 300 grams of the food.
5
100 g
300 g
1 tbsp - 13g 1 oz - 28.35g
Vitamin C
Vit. C
Vitamin D
Vit. D
Vitamin A
Vit. A
Vitamin E
Vit. E
Vitamin B1
Vit. B1
Vitamin B2
Vit. B2
Vitamin B3
Vit. B3
Vitamin B5
Vit. B5
Vitamin B6
Vit. B6
Vitamin B12
Vit. B12
Vitamin K
Vit. K
Folate
Folate
6.7%
0%
334%
0%
22%
69%
47%
72%
14%
1175%
0%
45%
5
100 g
300 g
3 oz - 85g 1 chop, excluding refuse (yield from 1 raw chop, with refuse, weighing 151 g) - 87g
Vitamin C
Vit. C
Vitamin D
Vit. D
Vitamin A
Vit. A
Vitamin E
Vit. E
Vitamin B1
Vit. B1
Vitamin B2
Vit. B2
Vitamin B3
Vit. B3
Vitamin B5
Vit. B5
Vitamin B6
Vit. B6
Vitamin B12
Vit. B12
Vitamin K
Vit. K
Folate
Folate
2%
20%
0.67%
5.8%
219%
74%
94%
42%
107%
88%
0%
3.8%
All nutrients comparison - raw data values
Nutrient
DV% diff.
Vitamin B12
9.4µg
0.7µg
363%
Vitamin A
1001µg
2µg
111%
Vitamin B1
0.088mg
0.877mg
66%
Iron
5.5mg
0.87mg
58%
Monounsaturated fat
25.61g
6.19g
49%
Fats
43.84g
13.92g
46%
Saturated fat
14.45g
5.23g
42%
Copper
0.4mg
0.073mg
36%
Protein
11.4g
27.32g
32%
Vitamin B6
0.06mg
0.464mg
31%
Sodium
697mg
62mg
28%
Cholesterol
150mg
80mg
23%
Choline
93.9mg
17%
Vitamin B3
2.51mg
5.037mg
16%
Folate
60µg
5µg
14%
Zinc
0.92mg
2.39mg
13%
Calories
462kcal
242kcal
11%
Vitamin B5
1.2mg
0.698mg
10%
Potassium
138mg
423mg
8%
Vitamin D*
53 IU
7%
Vitamin D
1.3µg
7%
Phosphorus
200mg
246mg
7%
Calcium
70mg
19mg
5%
Manganese
0.12mg
0.009mg
5%
Magnesium
13mg
28mg
4%
Vitamin C
2mg
0.6mg
2%
Carbs
4.67g
0g
2%
Vitamin E
0.29mg
2%
Selenium
44µg
45.3µg
2%
Vitamin B2
0.299mg
0.321mg
2%
Polyunsaturated fat
0.84g
1.2g
2%
Protein per 100 calories
2.5g
11g
N/A
Calories per 10 g protein
405kcal
89kcal
N/A
Weight per 100 calories
22g
41g
N/A
Unsaturated / Saturated Fat ratio
1.8
1.4
N/A
Net carbs
4.67g
0g
N/A
Tryptophan
0.161mg
0.338mg
0%
Threonine
0.507mg
1.234mg
0%
Isoleucine
0.606mg
1.26mg
0%
Leucine
1.029mg
2.177mg
0%
Lysine
0.863mg
2.446mg
0%
Methionine
0.27mg
0.712mg
0%
Phenylalanine
0.567mg
1.086mg
0%
Valine
0.719mg
1.473mg
0%
Histidine
0.303mg
1.067mg
0%
Macronutrient Comparison
Macronutrient breakdown side-by-side comparison
3
11%
44%
5%
37%
3%
Protein:
11.4 g
Fats:
43.84 g
Carbs:
4.67 g
Water:
37.04 g
Other:
3.05 g
2
27%
14%
58%
Protein:
27.32 g
Fats:
13.92 g
Carbs:
0 g
Water:
57.87 g
Other:
0.89 g
Contains
more
Fats Fats
+214.9%
Contains
more
Carbs Carbs
+∞%
Contains
more
Other Other
+242.7%
Contains
more
Protein Protein
+139.6%
Contains
more
Water Water
+56.2%
Fat Type Comparison
Fat type breakdown side-by-side comparison
1
35%
63%
2%
Saturated fat:
Sat. Fat
14.45 g
Monounsaturated fat:
Mono. Fat
25.61 g
Polyunsaturated fat:
Poly. Fat
0.84 g
2
41%
49%
10%
Saturated fat:
Sat. Fat
5.23 g
Monounsaturated fat:
Mono. Fat
6.19 g
Polyunsaturated fat:
Poly. Fat
1.2 g
Contains
more
Mono. Fat Monounsaturated fat
+313.7%
Contains
less
Sat. Fat Saturated fat
-63.8%
Contains
more
Poly. Fat Polyunsaturated fat
+42.9%