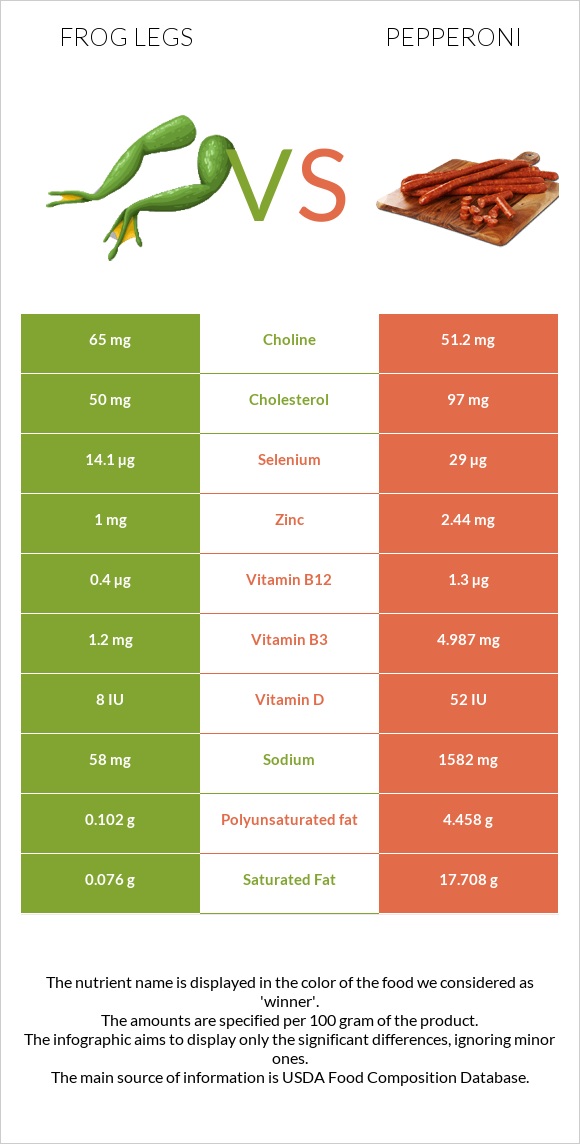
What are the differences between frog legs and pepperoni? Frog legs are higher in copper, yet pepperoni is higher in vitamin B12, selenium, vitamin B3, vitamin B6, zinc, and vitamin B1. Pepperoni's daily need coverage for saturated fat is 88% more. Frog legs have 3 times more copper than pepperoni. While frog legs have 0.25mg of copper, pepperoni has only 0.091mg. The amount of cholesterol in frog legs is lower. The glycemic index of frog legs is lower. We used Frog legs, raw and Pepperoni, beef, and pork, sliced types in this article.
Infographic
Mineral Comparison
Mineral comparison score is based on the number of minerals by which one or the other food is richer. The "coverage" charts below show how much of the daily needs can be covered by 300 grams of the food.
3
100 g
300 g
1 leg - 45g
Magnesium
Magnesium
Calcium
Calcium
Potassium
Potassium
Iron
Iron
Copper
Copper
Zinc
Zinc
Phosphorus
Phosphorus
Sodium
Sodium
Manganese
Manganese
Selenium
Selenium
14%
5.4%
25%
56%
83%
27%
63%
7.6%
0%
77%
3
100 g
300 g
1 piece - 2g 1 oz - 28g 3 oz - 85g
Magnesium
Magnesium
Calcium
Calcium
Potassium
Potassium
Iron
Iron
Copper
Copper
Zinc
Zinc
Phosphorus
Phosphorus
Sodium
Sodium
Manganese
Manganese
Selenium
Selenium
13%
5.7%
24%
50%
30%
67%
68%
206%
140%
158%
Vitamin Comparison
Vitamin comparison score is based on the number of vitamins by which one or the other food is richer. The "coverage" charts below show how much of the daily needs can be covered by 300 grams of the food.
2
100 g
300 g
1 leg - 45g
Vitamin C
Vit. C
Vitamin D
Vit. D
Vitamin A
Vit. A
Vitamin E
Vit. E
Vitamin B1
Vit. B1
Vitamin B2
Vit. B2
Vitamin B3
Vit. B3
Vitamin B5
Vit. B5
Vitamin B6
Vit. B6
Vitamin B12
Vit. B12
Vitamin K
Vit. K
Folate
Folate
0%
3%
5%
20%
35%
58%
23%
0%
28%
50%
0.25%
11%
7
100 g
300 g
1 piece - 2g 1 oz - 28g 3 oz - 85g
Vitamin C
Vit. C
Vitamin D
Vit. D
Vitamin A
Vit. A
Vitamin E
Vit. E
Vitamin B1
Vit. B1
Vitamin B2
Vit. B2
Vitamin B3
Vit. B3
Vitamin B5
Vit. B5
Vitamin B6
Vit. B6
Vitamin B12
Vit. B12
Vitamin K
Vit. K
Folate
Folate
0%
20%
0%
21%
68%
59%
94%
56%
84%
163%
15%
3.8%
All nutrients comparison - raw data values
Nutrient
DV% diff.
Saturated fat
0.076g
17.708g
80%
Fats
0.3g
46.28g
71%
Sodium
58mg
1582mg
66%
Monounsaturated fat
0.053g
20.77g
52%
Manganese
1.074mg
47%
Vitamin B12
0.4µg
1.3µg
38%
Polyunsaturated fat
0.102g
4.458g
29%
Selenium
14.1µg
29µg
27%
Vitamin B3
1.2mg
4.987mg
24%
Calories
73kcal
504kcal
22%
Vitamin B5
0.93mg
19%
Vitamin B6
0.12mg
0.362mg
19%
Copper
0.25mg
0.091mg
18%
Cholesterol
50mg
97mg
16%
Zinc
1mg
2.44mg
13%
Vitamin B1
0.14mg
0.271mg
11%
Protein
16.4g
19.25g
6%
Vitamin D*
8 IU
52 IU
6%
Vitamin D
0.2µg
1.3µg
6%
Vitamin K
0.1µg
5.8µg
5%
Folate
15µg
5µg
3%
Choline
65mg
51.2mg
3%
Iron
1.5mg
1.33mg
2%
Phosphorus
147mg
158mg
2%
Vitamin A
15µg
0µg
2%
Vitamin B2
0.25mg
0.257mg
1%
Protein per 100 calories
22g
3.8g
N/A
Calories per 10 g protein
45kcal
262kcal
N/A
Weight per 100 calories
137g
20g
N/A
Unsaturated / Saturated Fat ratio
2
1.4
N/A
Net carbs
0g
1.18g
N/A
Carbs
0g
1.18g
0%
Magnesium
20mg
18mg
0%
Calcium
18mg
19mg
0%
Potassium
285mg
274mg
0%
Vitamin E
1mg
1.03mg
0%
Trans fat
1.527g
N/A
Tryptophan
0.23mg
0%
Threonine
0.869mg
0%
Isoleucine
0.901mg
0%
Leucine
1.575mg
0%
Lysine
1.652mg
0%
Methionine
0.511mg
0%
Phenylalanine
0.778mg
0%
Valine
0.987mg
0%
Histidine
0.688mg
0%
Omega-3 - EPA
0.014g
0.004g
N/A
Omega-3 - DHA
0.02g
0.004g
N/A
Omega-3 - ALA
0.164g
N/A
Omega-3 - DPA
0.007g
0.02g
N/A
Omega-3 - Eicosatrienoic acid
0.018g
N/A
Omega-6 - Gamma-linoleic acid
0.002g
N/A
Omega-6 - Dihomo-gamma-linoleic acid
0.04g
N/A
Omega-6 - Eicosadienoic acid
0.136g
N/A
Omega-6 - Linoleic acid
3.605g
N/A
Macronutrient Comparison
Macronutrient breakdown side-by-side comparison
1
16%
82%
Protein:
16.4 g
Fats:
0.3 g
Carbs:
0 g
Water:
81.9 g
Other:
1.4 g
4
19%
46%
29%
5%
Protein:
19.25 g
Fats:
46.28 g
Carbs:
1.18 g
Water:
28.55 g
Other:
4.74 g
Contains
more
Water Water
+186.9%
Contains
more
Protein Protein
+17.4%
Contains
more
Fats Fats
+15326.7%
Contains
more
Carbs Carbs
+∞%
Contains
more
Other Other
+238.6%
Fat Type Comparison
Fat type breakdown side-by-side comparison
1
33%
23%
44%
Saturated fat:
Sat. Fat
0.076 g
Monounsaturated fat:
Mono. Fat
0.053 g
Polyunsaturated fat:
Poly. Fat
0.102 g
2
41%
48%
10%
Saturated fat:
Sat. Fat
17.708 g
Monounsaturated fat:
Mono. Fat
20.77 g
Polyunsaturated fat:
Poly. Fat
4.458 g
Contains
less
Sat. Fat Saturated fat
-99.6%
Contains
more
Mono. Fat Monounsaturated fat
+39088.7%
Contains
more
Poly. Fat Polyunsaturated fat
+4270.6%