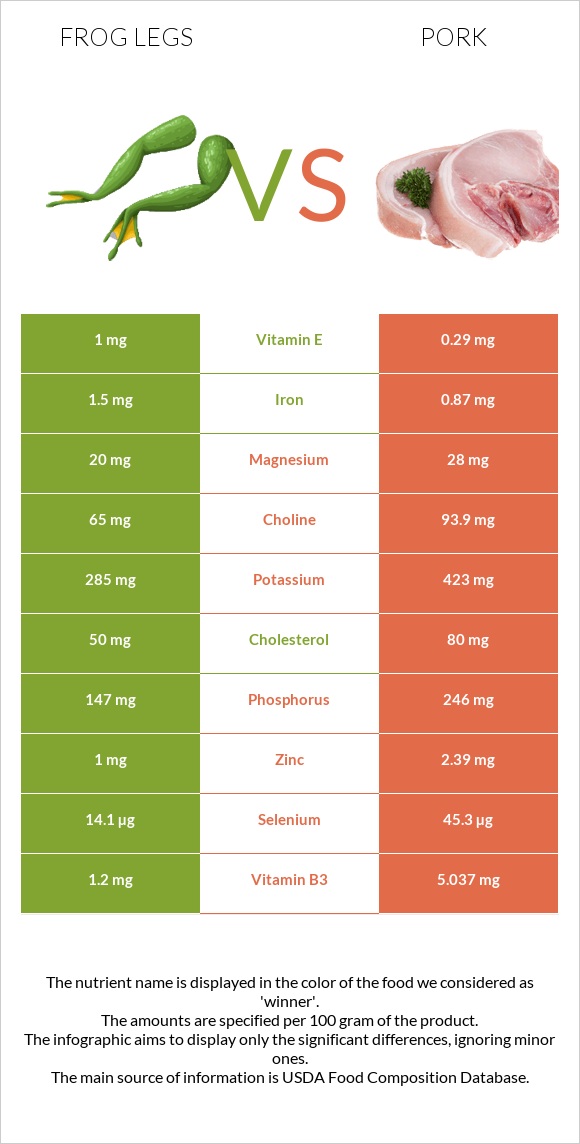
Important differences between frog legs and pork Frog legs have more copper; however, pork is richer in vitamin B1, selenium, vitamin B6, vitamin B3, phosphorus, zinc, and vitamin B12. Pork's daily need coverage for vitamin B1 is 61% more. Frog legs contain 3 times more copper than pork. Frog legs contain 0.25mg of copper, while pork contains 0.073mg. Frog legs contain less cholesterol. The food varieties used in the comparison are Frog legs, raw and Pork, fresh, loin, whole, separable lean, and fat, cooked, broiled .
Infographic
Mineral Comparison
Mineral comparison score is based on the number of minerals by which one or the other food is richer. The "coverage" charts below show how much of the daily needs can be covered by 300 grams of the food.
2
100 g
300 g
1 leg - 45g
Magnesium
Magnesium
Calcium
Calcium
Potassium
Potassium
Iron
Iron
Copper
Copper
Zinc
Zinc
Phosphorus
Phosphorus
Sodium
Sodium
Manganese
Manganese
Selenium
Selenium
14%
5.4%
25%
56%
83%
27%
63%
7.6%
0%
77%
6
100 g
300 g
3 oz - 85g 1 chop, excluding refuse (yield from 1 raw chop, with refuse, weighing 151 g) - 87g
Magnesium
Magnesium
Calcium
Calcium
Potassium
Potassium
Iron
Iron
Copper
Copper
Zinc
Zinc
Phosphorus
Phosphorus
Sodium
Sodium
Manganese
Manganese
Selenium
Selenium
20%
5.7%
37%
33%
24%
65%
105%
8.1%
1.2%
247%
Vitamin Comparison
Vitamin comparison score is based on the number of vitamins by which one or the other food is richer. The "coverage" charts below show how much of the daily needs can be covered by 300 grams of the food.
4
100 g
300 g
1 leg - 45g
Vitamin C
Vit. C
Vitamin D
Vit. D
Vitamin A
Vit. A
Vitamin E
Vit. E
Vitamin B1
Vit. B1
Vitamin B2
Vit. B2
Vitamin B3
Vit. B3
Vitamin B5
Vit. B5
Vitamin B6
Vit. B6
Vitamin B12
Vit. B12
Vitamin K
Vit. K
Folate
Folate
0%
3%
5%
20%
35%
58%
23%
0%
28%
50%
0.25%
11%
8
100 g
300 g
3 oz - 85g 1 chop, excluding refuse (yield from 1 raw chop, with refuse, weighing 151 g) - 87g
Vitamin C
Vit. C
Vitamin D
Vit. D
Vitamin A
Vit. A
Vitamin E
Vit. E
Vitamin B1
Vit. B1
Vitamin B2
Vit. B2
Vitamin B3
Vit. B3
Vitamin B5
Vit. B5
Vitamin B6
Vit. B6
Vitamin B12
Vit. B12
Vitamin K
Vit. K
Folate
Folate
2%
20%
0.67%
5.8%
219%
74%
94%
42%
107%
88%
0%
3.8%
All nutrients comparison - raw data values
Nutrient
DV% diff.
Vitamin B1
0.14mg
0.877mg
61%
Selenium
14.1µg
45.3µg
57%
Vitamin B6
0.12mg
0.464mg
26%
Vitamin B3
1.2mg
5.037mg
24%
Saturated fat
0.076g
5.23g
23%
Protein
16.4g
27.32g
22%
Fats
0.3g
13.92g
21%
Copper
0.25mg
0.073mg
20%
Monounsaturated fat
0.053g
6.19g
15%
Phosphorus
147mg
246mg
14%
Vitamin B5
0.698mg
14%
Zinc
1mg
2.39mg
13%
Vitamin B12
0.4µg
0.7µg
13%
Cholesterol
50mg
80mg
10%
Calories
73kcal
242kcal
8%
Iron
1.5mg
0.87mg
8%
Polyunsaturated fat
0.102g
1.2g
7%
Vitamin D*
8 IU
53 IU
6%
Vitamin D
0.2µg
1.3µg
6%
Vitamin E
1mg
0.29mg
5%
Vitamin B2
0.25mg
0.321mg
5%
Choline
65mg
93.9mg
5%
Potassium
285mg
423mg
4%
Folate
15µg
5µg
3%
Magnesium
20mg
28mg
2%
Vitamin C
0mg
0.6mg
1%
Vitamin A
15µg
2µg
1%
Protein per 100 calories
22g
11g
N/A
Calories per 10 g protein
45kcal
89kcal
N/A
Weight per 100 calories
137g
41g
N/A
Unsaturated / Saturated Fat ratio
2
1.4
N/A
Calcium
18mg
19mg
0%
Sodium
58mg
62mg
0%
Manganese
0.009mg
0%
Vitamin K
0.1µg
0µg
0%
Tryptophan
0.338mg
0%
Threonine
1.234mg
0%
Isoleucine
1.26mg
0%
Leucine
2.177mg
0%
Lysine
2.446mg
0%
Methionine
0.712mg
0%
Phenylalanine
1.086mg
0%
Valine
1.473mg
0%
Histidine
1.067mg
0%
Omega-3 - EPA
0.014g
0g
N/A
Omega-3 - DHA
0.02g
0g
N/A
Omega-3 - DPA
0.007g
0g
N/A
Macronutrient Comparison
Macronutrient breakdown side-by-side comparison
2
16%
82%
Protein:
16.4 g
Fats:
0.3 g
Carbs:
0 g
Water:
81.9 g
Other:
1.4 g
2
27%
14%
58%
Protein:
27.32 g
Fats:
13.92 g
Carbs:
0 g
Water:
57.87 g
Other:
0.89 g
Contains
more
Water Water
+41.5%
Contains
more
Other Other
+57.3%
Contains
more
Protein Protein
+66.6%
Contains
more
Fats Fats
+4540%
Fat Type Comparison
Fat type breakdown side-by-side comparison
1
33%
23%
44%
Saturated fat:
Sat. Fat
0.076 g
Monounsaturated fat:
Mono. Fat
0.053 g
Polyunsaturated fat:
Poly. Fat
0.102 g
2
41%
49%
10%
Saturated fat:
Sat. Fat
5.23 g
Monounsaturated fat:
Mono. Fat
6.19 g
Polyunsaturated fat:
Poly. Fat
1.2 g
Contains
less
Sat. Fat Saturated fat
-98.5%
Contains
more
Mono. Fat Monounsaturated fat
+11579.2%
Contains
more
Poly. Fat Polyunsaturated fat
+1076.5%