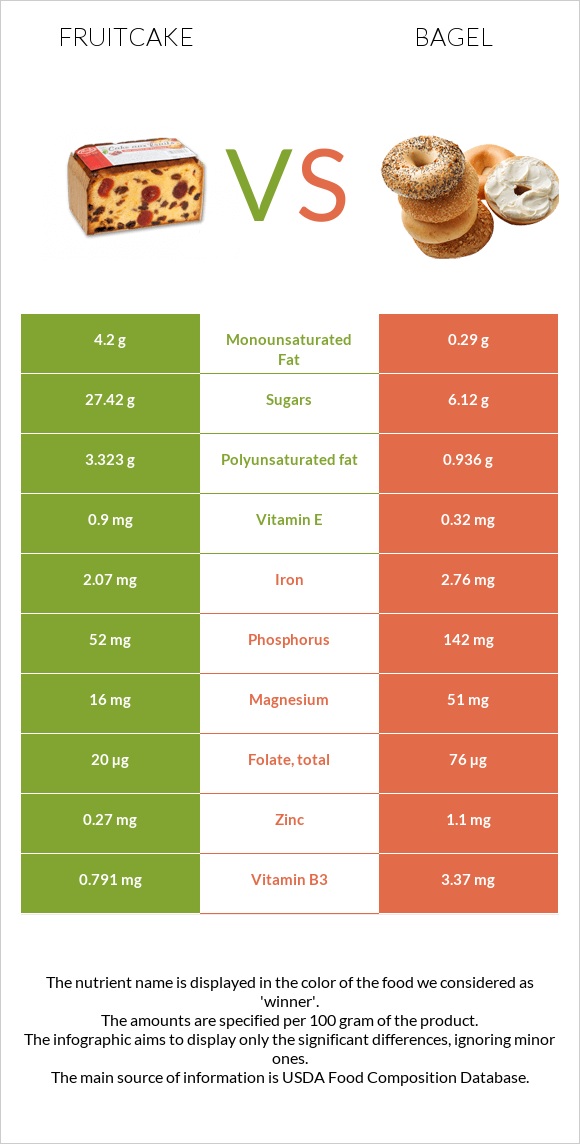
How are fruitcake and bagel different? Bagel is higher than fruitcake in manganese, selenium, vitamin B1, vitamin B3, folate, copper, phosphorus, iron, and vitamin B2. Bagel covers your daily need for manganese, 53% more than fruitcake. Fruitcake is lower in sodium. Bagel has a higher glycemic index (69) than fruitcake (53). Cake, fruitcake, commercially prepared and Bagels, wheat types were used in this article.
Infographic
Mineral Comparison
Mineral comparison score is based on the number of minerals by which one or the other food is richer. The "coverage" charts below show how much of the daily needs can be covered by 300 grams of the food.
2
100 g
300 g
1 oz - 28.35g 1 piece - 43g
Magnesium
Magnesium
Calcium
Calcium
Potassium
Potassium
Iron
Iron
Copper
Copper
Zinc
Zinc
Phosphorus
Phosphorus
Sodium
Sodium
Manganese
Manganese
Selenium
Selenium
11%
9.9%
14%
78%
17%
7.4%
22%
13%
29%
11%
7
100 g
300 g
1 bagel - 98g
Magnesium
Magnesium
Calcium
Calcium
Potassium
Potassium
Iron
Iron
Copper
Copper
Zinc
Zinc
Phosphorus
Phosphorus
Sodium
Sodium
Manganese
Manganese
Selenium
Selenium
36%
6%
15%
104%
58%
30%
61%
57%
187%
157%
Vitamin Comparison
Vitamin comparison score is based on the number of vitamins by which one or the other food is richer. The "coverage" charts below show how much of the daily needs can be covered by 300 grams of the food.
4
100 g
300 g
1 oz - 28.35g 1 piece - 43g
Vitamin C
Vit. C
Vitamin D
Vit. D
Vitamin A
Vit. A
Vitamin E
Vit. E
Vitamin B1
Vit. B1
Vitamin B2
Vit. B2
Vitamin B3
Vit. B3
Vitamin B5
Vit. B5
Vitamin B6
Vit. B6
Vitamin B12
Vit. B12
Vitamin K
Vit. K
Folate
Folate
1.7%
0%
2.3%
18%
13%
23%
15%
14%
11%
1.3%
3.8%
15%
6
100 g
300 g
1 bagel - 98g
Vitamin C
Vit. C
Vitamin D
Vit. D
Vitamin A
Vit. A
Vitamin E
Vit. E
Vitamin B1
Vit. B1
Vitamin B2
Vit. B2
Vitamin B3
Vit. B3
Vitamin B5
Vit. B5
Vitamin B6
Vit. B6
Vitamin B12
Vit. B12
Vitamin K
Vit. K
Folate
Folate
0%
0%
0%
6.4%
101%
48%
63%
23%
34%
0%
3.8%
57%
All nutrients comparison - raw data values
Nutrient
DV% diff.
Manganese
0.22mg
1.43mg
53%
Selenium
2µg
28.7µg
49%
Vitamin B1
0.05mg
0.403mg
29%
Vitamin B3
0.791mg
3.37mg
16%
Polyunsaturated fat
3.323g
0.936g
16%
Protein
2.9g
10.2g
15%
Sodium
101mg
439mg
15%
Copper
0.05mg
0.175mg
14%
Folate
20µg
76µg
14%
Phosphorus
52mg
142mg
13%
Fats
9.1g
1.53g
12%
Monounsaturated fat
4.2g
0.29g
10%
Iron
2.07mg
2.76mg
9%
Magnesium
16mg
51mg
8%
Zinc
0.27mg
1.1mg
8%
Vitamin B2
0.099mg
0.209mg
8%
Vitamin B6
0.046mg
0.147mg
8%
Saturated fat
1.048g
0g
5%
Calories
324kcal
250kcal
4%
Carbs
61.6g
48.89g
4%
Vitamin E
0.9mg
0.32mg
4%
Vitamin B5
0.226mg
0.375mg
3%
Cholesterol
5mg
0mg
2%
Fiber
3.7g
4.1g
2%
Vitamin C
0.5mg
0mg
1%
Calcium
33mg
20mg
1%
Vitamin A
7µg
0µg
1%
Protein per 100 calories
0.9g
4.1g
N/A
Calories per 10 g protein
1117kcal
245kcal
N/A
Weight per 100 calories
31g
40g
N/A
Unsaturated / Saturated Fat ratio
7.2
N/A
Net carbs
57.9g
44.79g
N/A
Potassium
153mg
165mg
0%
Sugar
27.42g
6.12g
N/A
Vitamin B12
0.01µg
0µg
0%
Vitamin K
1.5µg
1.5µg
0%
Choline
8.9mg
9.8mg
0%
Tryptophan
0.042mg
0%
Threonine
0.102mg
0%
Isoleucine
0.121mg
0%
Leucine
0.206mg
0%
Lysine
0.121mg
0%
Methionine
0.059mg
0%
Phenylalanine
0.14mg
0%
Valine
0.144mg
0%
Histidine
0.071mg
0%
Omega-3 - DHA
0.001g
0g
N/A
Macronutrient Comparison
Macronutrient breakdown side-by-side comparison
2
3%
9%
62%
25%
Protein:
2.9 g
Fats:
9.1 g
Carbs:
61.6 g
Water:
25.3 g
Other:
1.1 g
3
10%
49%
38%
2%
Protein:
10.2 g
Fats:
1.53 g
Carbs:
48.89 g
Water:
37.55 g
Other:
1.83 g
Contains
more
Fats Fats
+494.8%
Contains
more
Carbs Carbs
+26%
Contains
more
Protein Protein
+251.7%
Contains
more
Water Water
+48.4%
Contains
more
Other Other
+66.4%
Fat Type Comparison
Fat type breakdown side-by-side comparison
2
12%
49%
39%
Saturated fat:
Sat. Fat
1.048 g
Monounsaturated fat:
Mono. Fat
4.2 g
Polyunsaturated fat:
Poly. Fat
3.323 g
1
24%
76%
Saturated fat:
Sat. Fat
0 g
Monounsaturated fat:
Mono. Fat
0.29 g
Polyunsaturated fat:
Poly. Fat
0.936 g
Contains
more
Mono. Fat Monounsaturated fat
+1348.3%
Contains
more
Poly. Fat Polyunsaturated fat
+255%
Contains
less
Sat. Fat Saturated fat
-100%