A recap on the differences between fruitcake and pecan pie Fruitcake has more iron; however, pecan pie is higher in manganese, selenium, copper, vitamin B1, zinc, and vitamin A. Pecan pie covers your daily cholesterol needs 27% more than fruitcake. Fruitcake has less sodium. Food varieties used in this article are Cake, fruitcake, commercially prepared and Pie, pecan, prepared from recipe .
Infographic
Mineral Comparison
Mineral comparison score is based on the number of minerals by which one or the other food is richer. The "coverage" charts below show how much of the daily needs can be covered by 300 grams of the food.
3
100 g
300 g
1 oz - 28.35g 1 piece - 43g
Magnesium
Magnesium
Calcium
Calcium
Potassium
Potassium
Iron
Iron
Copper
Copper
Zinc
Zinc
Phosphorus
Phosphorus
Sodium
Sodium
Manganese
Manganese
Selenium
Selenium
11%
9.9%
14%
78%
17%
7.4%
22%
13%
29%
11%
6
100 g
300 g
1 oz - 28.35g 1 piece (1/8 of 9" dia) - 122g
Magnesium
Magnesium
Calcium
Calcium
Potassium
Potassium
Iron
Iron
Copper
Copper
Zinc
Zinc
Phosphorus
Phosphorus
Sodium
Sodium
Manganese
Manganese
Selenium
Selenium
19%
9.6%
12%
56%
70%
28%
40%
34%
93%
65%
Vitamin Comparison
Vitamin comparison score is based on the number of vitamins by which one or the other food is richer. The "coverage" charts below show how much of the daily needs can be covered by 300 grams of the food.
3
100 g
300 g
1 oz - 28.35g 1 piece - 43g
Vitamin C
Vit. C
Vitamin D
Vit. D
Vitamin A
Vit. A
Vitamin E
Vit. E
Vitamin B1
Vit. B1
Vitamin B2
Vit. B2
Vitamin B3
Vit. B3
Vitamin B5
Vit. B5
Vitamin B6
Vit. B6
Vitamin B12
Vit. B12
Vitamin K
Vit. K
Folate
Folate
1.7%
0%
2.3%
18%
13%
23%
15%
14%
11%
1.3%
3.8%
15%
7
100 g
300 g
1 oz - 28.35g 1 piece (1/8 of 9" dia) - 122g
Vitamin C
Vit. C
Vitamin D
Vit. D
Vitamin A
Vit. A
Vitamin E
Vit. E
Vitamin B1
Vit. B1
Vitamin B2
Vit. B2
Vitamin B3
Vit. B3
Vitamin B5
Vit. B5
Vitamin B6
Vit. B6
Vitamin B12
Vit. B12
Vitamin K
Vit. K
Folate
Folate
0.67%
0%
27%
0%
47%
42%
16%
29%
14%
21%
0%
20%
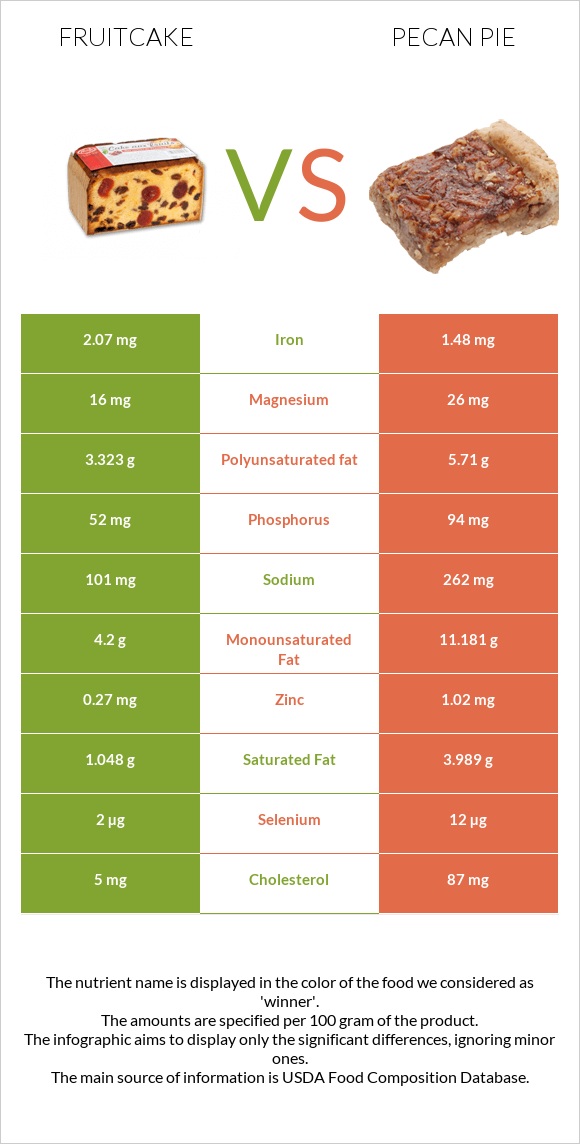
All nutrients comparison - raw data values
Nutrient
DV% diff.
Cholesterol
5mg
87mg
27%
Manganese
0.22mg
0.712mg
21%
Fats
9.1g
22.2g
20%
Copper
0.05mg
0.211mg
18%
Selenium
2µg
12µg
18%
Monounsaturated fat
4.2g
11.181g
17%
Polyunsaturated fat
3.323g
5.71g
16%
Fiber
3.7g
15%
Saturated fat
1.048g
3.989g
13%
Vitamin B1
0.05mg
0.188mg
12%
Vitamin A
7µg
82µg
8%
Iron
2.07mg
1.48mg
7%
Zinc
0.27mg
1.02mg
7%
Sodium
101mg
262mg
7%
Vitamin B12
0.01µg
0.17µg
7%
Phosphorus
52mg
94mg
6%
Vitamin E
0.9mg
6%
Vitamin B2
0.099mg
0.18mg
6%
Vitamin B5
0.226mg
0.479mg
5%
Calories
324kcal
412kcal
4%
Protein
2.9g
4.9g
4%
Carbs
61.6g
52.2g
3%
Magnesium
16mg
26mg
2%
Folate
20µg
26µg
2%
Choline
8.9mg
2%
Potassium
153mg
133mg
1%
Vitamin B6
0.046mg
0.06mg
1%
Vitamin K
1.5µg
1%
Protein per 100 calories
0.9g
1.2g
N/A
Calories per 10 g protein
1117kcal
841kcal
N/A
Weight per 100 calories
31g
24g
N/A
Unsaturated / Saturated Fat ratio
7.2
4.2
N/A
Vitamin C
0.5mg
0.2mg
0%
Net carbs
57.9g
52.2g
N/A
Calcium
33mg
32mg
0%
Sugar
27.42g
N/A
Vitamin B3
0.791mg
0.847mg
0%
Tryptophan
0.042mg
0.069mg
0%
Threonine
0.102mg
0.189mg
0%
Isoleucine
0.121mg
0.223mg
0%
Leucine
0.206mg
0.372mg
0%
Lysine
0.121mg
0.248mg
0%
Methionine
0.059mg
0.125mg
0%
Phenylalanine
0.14mg
0.25mg
0%
Valine
0.144mg
0.255mg
0%
Histidine
0.071mg
0.116mg
0%
Omega-3 - EPA
0g
0.001g
N/A
Omega-3 - DHA
0.001g
0.008g
N/A
Macronutrient Comparison
Macronutrient breakdown side-by-side comparison
2
3%
9%
62%
25%
Protein:
2.9 g
Fats:
9.1 g
Carbs:
61.6 g
Water:
25.3 g
Other:
1.1 g
3
5%
22%
52%
20%
Protein:
4.9 g
Fats:
22.2 g
Carbs:
52.2 g
Water:
19.5 g
Other:
1.2 g
Contains
more
Carbs Carbs
+18%
Contains
more
Water Water
+29.7%
Contains
more
Protein Protein
+69%
Contains
more
Fats Fats
+144%
Fat Type Comparison
Fat type breakdown side-by-side comparison
1
12%
49%
39%
Saturated fat:
Sat. Fat
1.048 g
Monounsaturated fat:
Mono. Fat
4.2 g
Polyunsaturated fat:
Poly. Fat
3.323 g
2
19%
54%
27%
Saturated fat:
Sat. Fat
3.989 g
Monounsaturated fat:
Mono. Fat
11.181 g
Polyunsaturated fat:
Poly. Fat
5.71 g
Contains
less
Sat. Fat Saturated fat
-73.7%
Contains
more
Mono. Fat Monounsaturated fat
+166.2%
Contains
more
Poly. Fat Polyunsaturated fat
+71.8%