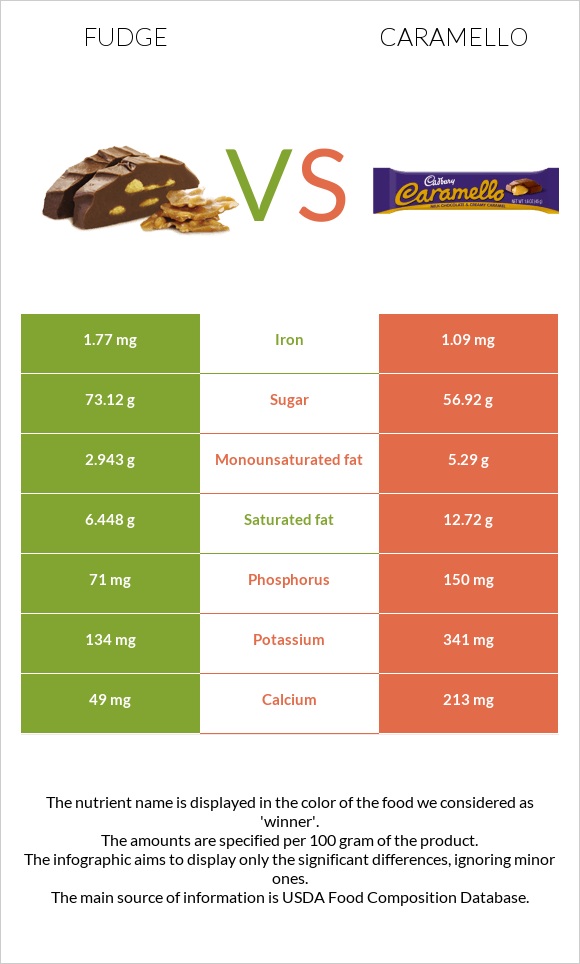
A recap on the differences between fudge and caramello Fudge has more iron; however, caramello is higher in calcium, phosphorus, potassium, and monounsaturated fat. Caramello covers your daily saturated fat needs 31% more than fudge. Caramello contains 2 times less iron than fudge. Fudge contains 1.77mg of iron, while caramello contains 1.09mg. Caramello has less sugar. Food varieties used in this article are Candies, fudge, chocolate, prepared-from-recipe and Candies, CARAMELLO Candy Bar .
Infographic
Mineral Comparison
Mineral comparison score is based on the number of minerals by which one or the other food is richer. The "coverage" charts below show how much of the daily needs can be covered by 300 grams of the food.
7
100 g
300 g
1 piece - 17g
Magnesium
Magnesium
Calcium
Calcium
Potassium
Potassium
Iron
Iron
Copper
Copper
Zinc
Zinc
Phosphorus
Phosphorus
Sodium
Sodium
Manganese
Manganese
Selenium
Selenium
26%
15%
12%
66%
110%
30%
30%
5.9%
55%
14%
3
100 g
300 g
1 bar 1.25 oz - 35g 6 blocks - 43g 1 bar 1.6 oz - 45g
Magnesium
Magnesium
Calcium
Calcium
Potassium
Potassium
Iron
Iron
Copper
Copper
Zinc
Zinc
Phosphorus
Phosphorus
Sodium
Sodium
Manganese
Manganese
Selenium
Selenium
0%
64%
30%
41%
0%
0%
64%
16%
0%
0%
Vitamin Comparison
Vitamin comparison score is based on the number of vitamins by which one or the other food is richer. The "coverage" charts below show how much of the daily needs can be covered by 300 grams of the food.
10
100 g
300 g
1 piece - 17g
Vitamin C
Vit. C
Vitamin D
Vit. D
Vitamin A
Vit. A
Vitamin E
Vit. E
Vitamin B1
Vit. B1
Vitamin B2
Vit. B2
Vitamin B3
Vit. B3
Vitamin B5
Vit. B5
Vitamin B6
Vit. B6
Vitamin B12
Vit. B12
Vitamin K
Vit. K
Folate
Folate
0%
0%
15%
3.6%
6.5%
20%
3.3%
8.4%
2.8%
11%
3.5%
3%
1
100 g
300 g
1 bar 1.25 oz - 35g 6 blocks - 43g 1 bar 1.6 oz - 45g
Vitamin C
Vit. C
Vitamin D
Vit. D
Vitamin A
Vit. A
Vitamin E
Vit. E
Vitamin B1
Vit. B1
Vitamin B2
Vit. B2
Vitamin B3
Vit. B3
Vitamin B5
Vit. B5
Vitamin B6
Vit. B6
Vitamin B12
Vit. B12
Vitamin K
Vit. K
Folate
Folate
5.7%
0%
0%
0%
0%
0%
0%
0%
0%
0%
0%
0%
All nutrients comparison - raw data values
Nutrient
DV% diff.
Copper
0.329mg
37%
Saturated fat
6.448g
12.72g
29%
Manganese
0.422mg
18%
Fats
10.41g
21.19g
17%
Calcium
49mg
213mg
16%
Phosphorus
71mg
150mg
11%
Zinc
1.11mg
10%
Magnesium
36mg
9%
Iron
1.77mg
1.09mg
9%
Protein
2.39g
6.19g
8%
Vitamin B2
0.085mg
7%
Potassium
134mg
341mg
6%
Monounsaturated fat
2.943g
5.29g
6%
Vitamin A
44µg
5%
Selenium
2.5µg
5%
Carbs
76.44g
63.81g
4%
Cholesterol
14mg
27mg
4%
Vitamin B12
0.09µg
4%
Calories
411kcal
462kcal
3%
Sodium
45mg
122mg
3%
Vitamin B5
0.14mg
3%
Vitamin C
0mg
1.7mg
2%
Fiber
1.7g
1.2g
2%
Vitamin B1
0.026mg
2%
Choline
10mg
2%
Polyunsaturated fat
0.373g
0.63g
2%
Caffeine
8mg
2%
Vitamin E
0.18mg
1%
Vitamin B3
0.176mg
1%
Vitamin B6
0.012mg
1%
Vitamin K
1.4µg
1%
Folate
4µg
1%
Protein per 100 calories
0.58g
1.3g
N/A
Calories per 10 g protein
1720kcal
746kcal
N/A
Weight per 100 calories
24g
22g
N/A
Unsaturated / Saturated Fat ratio
0.51
0.47
N/A
Net carbs
74.74g
62.61g
N/A
Sugar
73.12g
56.92g
N/A
Trans fat
0.165g
N/A
Macronutrient Comparison
Macronutrient breakdown side-by-side comparison
2
2%
10%
76%
10%
Protein:
2.39 g
Fats:
10.41 g
Carbs:
76.44 g
Water:
9.81 g
Other:
0.95 g
3
6%
21%
64%
7%
2%
Protein:
6.19 g
Fats:
21.19 g
Carbs:
63.81 g
Water:
6.79 g
Other:
2.02 g
Contains
more
Carbs Carbs
+19.8%
Contains
more
Water Water
+44.5%
Contains
more
Protein Protein
+159%
Contains
more
Fats Fats
+103.6%
Contains
more
Other Other
+112.6%
Fat Type Comparison
Fat type breakdown side-by-side comparison
1
66%
30%
4%
Saturated fat:
Sat. Fat
6.448 g
Monounsaturated fat:
Mono. Fat
2.943 g
Polyunsaturated fat:
Poly. Fat
0.373 g
2
68%
28%
3%
Saturated fat:
Sat. Fat
12.72 g
Monounsaturated fat:
Mono. Fat
5.29 g
Polyunsaturated fat:
Poly. Fat
0.63 g
Contains
less
Sat. Fat Saturated fat
-49.3%
Contains
more
Mono. Fat Monounsaturated fat
+79.7%
Contains
more
Poly. Fat Polyunsaturated fat
+68.9%