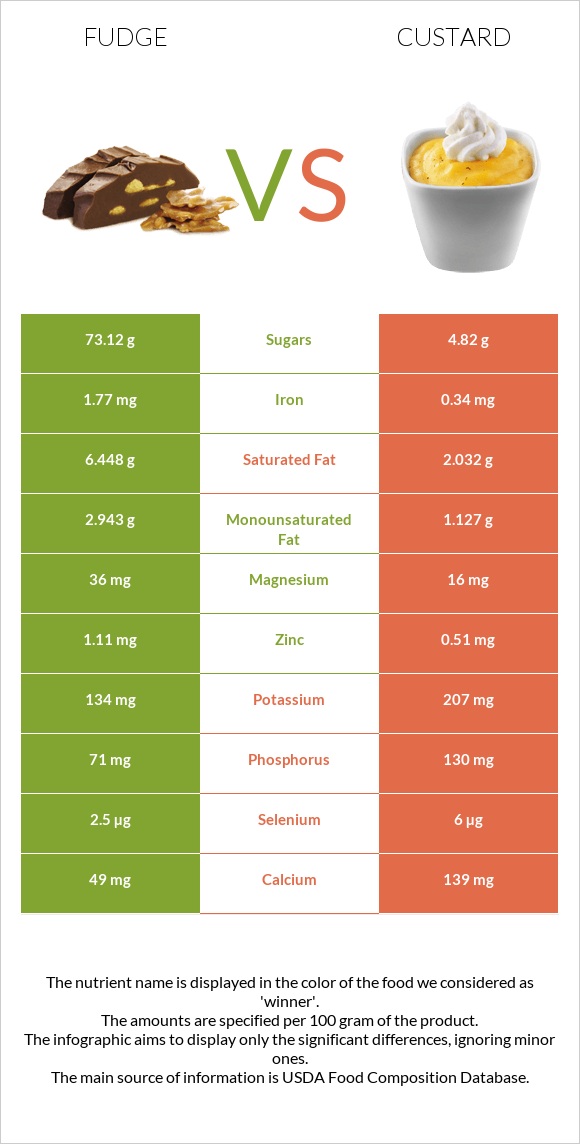
Significant differences between fudge and custard Fudge is richer in copper, manganese, and iron, while custard is higher in vitamin B12, vitamin B5, vitamin B2, calcium, and phosphorus. Fudge covers your daily copper needs 33% more than custard. Fudge has 60 times more manganese than custard. Fudge has 0.422mg of manganese, while custard has 0.007mg. Custard is lower in saturated fat. Fudge has a higher glycemic index (49) than custard (35). Specific food types used in this comparison are Candies, fudge, chocolate, prepared-from-recipe and Egg custards, dry mix, prepared with whole milk .
Infographic
Mineral Comparison
Mineral comparison score is based on the number of minerals by which one or the other food is richer. The "coverage" charts below show how much of the daily needs can be covered by 300 grams of the food.
6
100 g
300 g
1 piece - 17g
Magnesium
Magnesium
Calcium
Calcium
Potassium
Potassium
Iron
Iron
Copper
Copper
Zinc
Zinc
Phosphorus
Phosphorus
Sodium
Sodium
Manganese
Manganese
Selenium
Selenium
26%
15%
12%
66%
110%
30%
30%
5.9%
55%
14%
4
100 g
300 g
0.5 cup - 141g
Magnesium
Magnesium
Calcium
Calcium
Potassium
Potassium
Iron
Iron
Copper
Copper
Zinc
Zinc
Phosphorus
Phosphorus
Sodium
Sodium
Manganese
Manganese
Selenium
Selenium
11%
42%
18%
13%
10%
14%
56%
11%
0.91%
33%
Vitamin Comparison
Vitamin comparison score is based on the number of vitamins by which one or the other food is richer. The "coverage" charts below show how much of the daily needs can be covered by 300 grams of the food.
3
100 g
300 g
1 piece - 17g
Vitamin C
Vit. C
Vitamin D
Vit. D
Vitamin A
Vit. A
Vitamin E
Vit. E
Vitamin B1
Vit. B1
Vitamin B2
Vit. B2
Vitamin B3
Vit. B3
Vitamin B5
Vit. B5
Vitamin B6
Vit. B6
Vitamin B12
Vit. B12
Vitamin K
Vit. K
Folate
Folate
0%
0%
15%
3.6%
6.5%
20%
3.3%
8.4%
2.8%
11%
3.5%
3%
9
100 g
300 g
0.5 cup - 141g
Vitamin C
Vit. C
Vitamin D
Vit. D
Vitamin A
Vit. A
Vitamin E
Vit. E
Vitamin B1
Vit. B1
Vitamin B2
Vit. B2
Vitamin B3
Vit. B3
Vitamin B5
Vit. B5
Vitamin B6
Vit. B6
Vitamin B12
Vit. B12
Vitamin K
Vit. K
Folate
Folate
0.33%
18%
17%
1.2%
15%
51%
2.5%
42%
15%
65%
0.5%
6.8%
All nutrients comparison - raw data values
Nutrient
DV% diff.
Copper
0.329mg
0.03mg
33%
Carbs
76.44g
17.6g
20%
Saturated fat
6.448g
2.032g
20%
Iron
1.77mg
0.34mg
18%
Manganese
0.422mg
0.007mg
18%
Vitamin B12
0.09µg
0.52µg
18%
Calories
411kcal
122kcal
14%
Cholesterol
14mg
51mg
12%
Vitamin B5
0.14mg
0.699mg
11%
Fats
10.41g
4g
10%
Vitamin B2
0.085mg
0.22mg
10%
Calcium
49mg
139mg
9%
Phosphorus
71mg
130mg
8%
Fiber
1.7g
0g
7%
Vitamin D*
0 IU
47 IU
6%
Vitamin D
0µg
1.2µg
6%
Selenium
2.5µg
6µg
6%
Magnesium
36mg
16mg
5%
Zinc
1.11mg
0.51mg
5%
Monounsaturated fat
2.943g
1.127g
5%
Vitamin B6
0.012mg
0.064mg
4%
Protein
2.39g
3.99g
3%
Vitamin B1
0.026mg
0.061mg
3%
Potassium
134mg
207mg
2%
Sodium
45mg
84mg
2%
Caffeine
8mg
0mg
2%
Vitamin A
44µg
52µg
1%
Vitamin E
0.18mg
0.06mg
1%
Vitamin K
1.4µg
0.2µg
1%
Folate
4µg
9µg
1%
Protein per 100 calories
0.58g
3.3g
N/A
Calories per 10 g protein
1720kcal
306kcal
N/A
Weight per 100 calories
24g
82g
N/A
Unsaturated / Saturated Fat ratio
0.51
0.71
N/A
Vitamin C
0mg
0.1mg
0%
Net carbs
74.74g
17.6g
N/A
Sugar
73.12g
4.82g
N/A
Vitamin B3
0.176mg
0.132mg
0%
Trans fat
0.165g
N/A
Choline
10mg
11.8mg
0%
Polyunsaturated fat
0.373g
0.312g
0%
Tryptophan
0.082mg
0%
Threonine
0.192mg
0%
Isoleucine
0.207mg
0%
Leucine
0.337mg
0%
Lysine
0.214mg
0%
Methionine
0.091mg
0%
Phenylalanine
0.173mg
0%
Valine
0.233mg
0%
Histidine
0.092mg
0%
Omega-3 - DHA
0g
0.003g
N/A
Macronutrient Comparison
Macronutrient breakdown side-by-side comparison
2
2%
10%
76%
10%
Protein:
2.39 g
Fats:
10.41 g
Carbs:
76.44 g
Water:
9.81 g
Other:
0.95 g
3
4%
4%
18%
73%
Protein:
3.99 g
Fats:
4 g
Carbs:
17.6 g
Water:
73.45 g
Other:
0.96 g
Contains
more
Fats Fats
+160.3%
Contains
more
Carbs Carbs
+334.3%
Contains
more
Protein Protein
+66.9%
Contains
more
Water Water
+648.7%
Fat Type Comparison
Fat type breakdown side-by-side comparison
2
66%
30%
4%
Saturated fat:
Sat. Fat
6.448 g
Monounsaturated fat:
Mono. Fat
2.943 g
Polyunsaturated fat:
Poly. Fat
0.373 g
1
59%
32%
9%
Saturated fat:
Sat. Fat
2.032 g
Monounsaturated fat:
Mono. Fat
1.127 g
Polyunsaturated fat:
Poly. Fat
0.312 g
Contains
more
Mono. Fat Monounsaturated fat
+161.1%
Contains
more
Poly. Fat Polyunsaturated fat
+19.6%
Contains
less
Sat. Fat Saturated fat
-68.5%