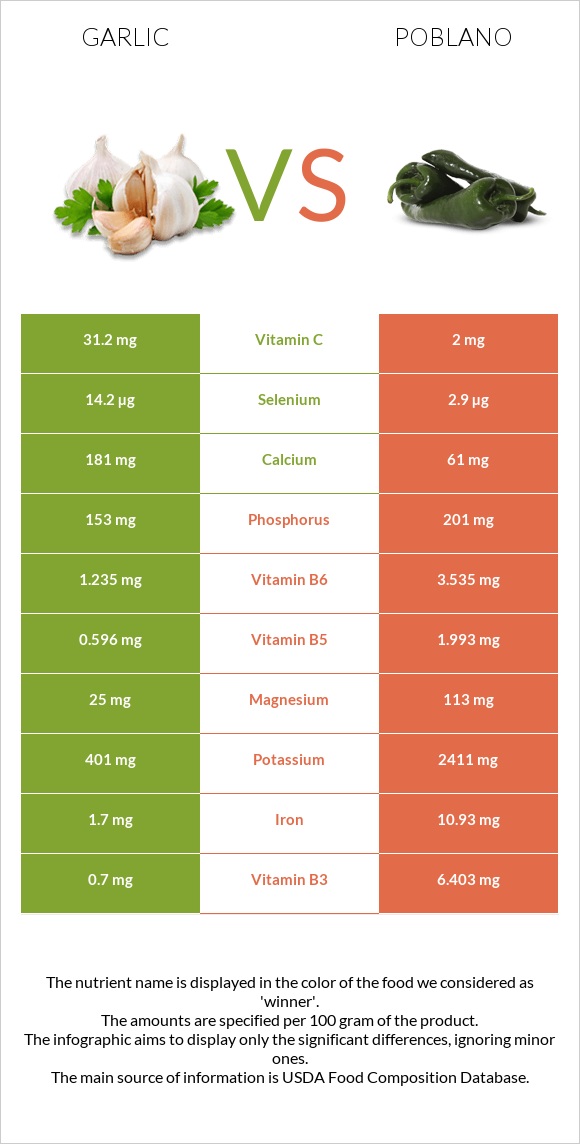
Summary of differences between garlic and poblano Garlic has more vitamin C; however, poblano is higher in vitamin A, vitamin B6, vitamin B2, iron, fiber, potassium, vitamin B3, vitamin B5, and copper. Poblano covers your daily need for vitamin A, 409% more than garlic. Garlic has 16 times more vitamin C than poblano. While garlic has 31.2mg of vitamin C, poblano has only 2mg. These are the specific foods used in this comparison Garlic, raw and Peppers, ancho, dried .
Infographic
Mineral Comparison
Mineral comparison score is based on the number of minerals by which one or the other food is richer. The "coverage" charts below show how much of the daily needs can be covered by 300 grams of the food.
4
100 g
300 g
1 tsp - 2.8g 1 clove - 3g 3 cloves - 9g 1 cup - 136g
Magnesium
Magnesium
Calcium
Calcium
Potassium
Potassium
Iron
Iron
Copper
Copper
Zinc
Zinc
Phosphorus
Phosphorus
Sodium
Sodium
Manganese
Manganese
Selenium
Selenium
18%
54%
35%
64%
100%
32%
66%
2.2%
218%
77%
6
100 g
300 g
1 pepper - 17g
Magnesium
Magnesium
Calcium
Calcium
Potassium
Potassium
Iron
Iron
Copper
Copper
Zinc
Zinc
Phosphorus
Phosphorus
Sodium
Sodium
Manganese
Manganese
Selenium
Selenium
81%
18%
213%
410%
169%
39%
86%
5.6%
167%
16%
Vitamin Comparison
Vitamin comparison score is based on the number of vitamins by which one or the other food is richer. The "coverage" charts below show how much of the daily needs can be covered by 300 grams of the food.
4
100 g
300 g
1 tsp - 2.8g 1 clove - 3g 3 cloves - 9g 1 cup - 136g
Vitamin C
Vit. C
Vitamin D
Vit. D
Vitamin A
Vit. A
Vitamin E
Vit. E
Vitamin B1
Vit. B1
Vitamin B2
Vit. B2
Vitamin B3
Vit. B3
Vitamin B5
Vit. B5
Vitamin B6
Vit. B6
Vitamin B12
Vit. B12
Vitamin K
Vit. K
Folate
Folate
104%
0%
0%
1.6%
50%
25%
13%
36%
285%
0%
4.3%
2.3%
6
100 g
300 g
1 pepper - 17g
Vitamin C
Vit. C
Vitamin D
Vit. D
Vitamin A
Vit. A
Vitamin E
Vit. E
Vitamin B1
Vit. B1
Vitamin B2
Vit. B2
Vitamin B3
Vit. B3
Vitamin B5
Vit. B5
Vitamin B6
Vit. B6
Vitamin B12
Vit. B12
Vitamin K
Vit. K
Folate
Folate
6.7%
0%
341%
0%
45%
520%
120%
120%
816%
0%
0%
52%
All nutrients comparison - raw data values
Nutrient
DV% diff.
Vitamin B6
1.235mg
3.535mg
177%
Vitamin B2
0.11mg
2.255mg
165%
Iron
1.7mg
10.93mg
115%
Vitamin A
0µg
1022µg
114%
Fiber
2.1g
21.6g
78%
Potassium
401mg
2411mg
59%
Vitamin B3
0.7mg
6.403mg
36%
Vitamin C
31.2mg
2mg
32%
Vitamin B5
0.596mg
1.993mg
28%
Polyunsaturated fat
0.249g
4.511g
28%
Copper
0.299mg
0.508mg
23%
Magnesium
25mg
113mg
21%
Selenium
14.2µg
2.9µg
21%
Manganese
1.672mg
1.279mg
17%
Folate
3µg
69µg
17%
Fats
0.5g
8.2g
12%
Calcium
181mg
61mg
12%
Protein
6.36g
11.86g
11%
Calories
149kcal
281kcal
7%
Phosphorus
153mg
201mg
7%
Carbs
33.06g
51.42g
6%
Choline
23.2mg
4%
Saturated fat
0.089g
0.82g
3%
Zinc
1.16mg
1.42mg
2%
Vitamin B1
0.2mg
0.179mg
2%
Sodium
17mg
43mg
1%
Vitamin E
0.08mg
1%
Vitamin K
1.7µg
1%
Monounsaturated fat
0.011g
0.492g
1%
Protein per 100 calories
4.3g
4.2g
N/A
Calories per 10 g protein
234kcal
237kcal
N/A
Weight per 100 calories
67g
36g
N/A
Unsaturated / Saturated Fat ratio
2.9
6.1
N/A
Net carbs
30.96g
29.82g
N/A
Sugar
1g
N/A
Tryptophan
0.066mg
0.155mg
0%
Threonine
0.157mg
0.425mg
0%
Isoleucine
0.217mg
0.373mg
0%
Leucine
0.308mg
0.605mg
0%
Lysine
0.273mg
0.515mg
0%
Methionine
0.076mg
0.142mg
0%
Phenylalanine
0.183mg
0.361mg
0%
Valine
0.291mg
0.489mg
0%
Histidine
0.113mg
0.232mg
0%
Macronutrient Comparison
Macronutrient breakdown side-by-side comparison
1
6%
33%
59%
Protein:
6.36 g
Fats:
0.5 g
Carbs:
33.06 g
Water:
58.58 g
Other:
1.5 g
4
12%
8%
51%
23%
6%
Protein:
11.86 g
Fats:
8.2 g
Carbs:
51.42 g
Water:
22.63 g
Other:
5.89 g
Contains
more
Water Water
+158.9%
Contains
more
Protein Protein
+86.5%
Contains
more
Fats Fats
+1540%
Contains
more
Carbs Carbs
+55.5%
Contains
more
Other Other
+292.7%
Fat Type Comparison
Fat type breakdown side-by-side comparison
1
26%
3%
71%
Saturated fat:
Sat. Fat
0.089 g
Monounsaturated fat:
Mono. Fat
0.011 g
Polyunsaturated fat:
Poly. Fat
0.249 g
2
14%
8%
77%
Saturated fat:
Sat. Fat
0.82 g
Monounsaturated fat:
Mono. Fat
0.492 g
Polyunsaturated fat:
Poly. Fat
4.511 g
Contains
less
Sat. Fat Saturated fat
-89.1%
Contains
more
Mono. Fat Monounsaturated fat
+4372.7%
Contains
more
Poly. Fat Polyunsaturated fat
+1711.6%