General Mills Franken Berry vs. General Mills Boo Berry — In-Depth Nutrition Comparison
Compare
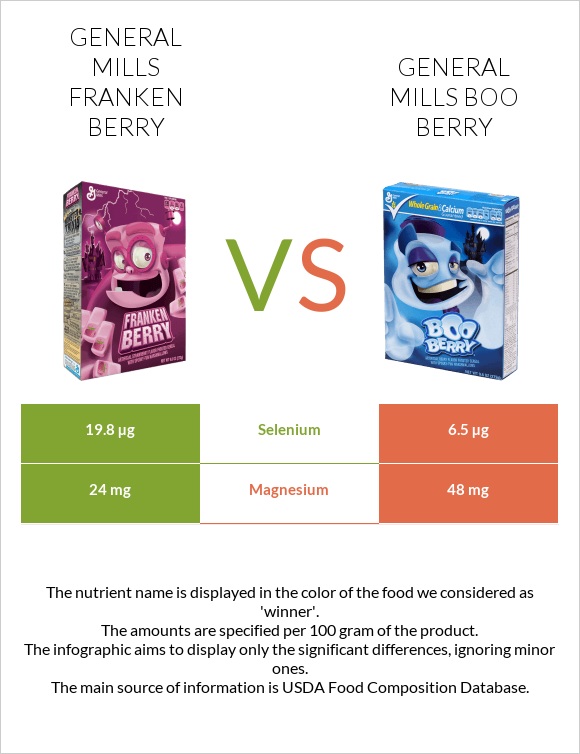
Differences between general Mills Franken Berry and general Mills Boo Berry
- General Mills Franken Berry has more selenium, while general Mills Boo Berry has more magnesium.
- General Mills Franken Berry's daily need coverage for selenium is 24% higher.
The food types used in this comparison are Cereals ready-to-eat, GENERAL MILLS, FRANKENBERRY and Cereals ready-to-eat, GENERAL MILLS, BOO BERRY.
Infographic
Infographic link
Mineral Comparison
Mineral comparison score is based on the number of minerals by which one or the other food is richer. The "coverage" charts below show how much of the daily needs can be covered by 300 grams of the food.
| Contains more SeleniumSelenium | +204.6% |
| Contains more MagnesiumMagnesium | +100% |
Vitamin Comparison
Vitamin comparison score is based on the number of vitamins by which one or the other food is richer. The "coverage" charts below show how much of the daily needs can be covered by 300 grams of the food.
| Contains more Vitamin EVitamin E | +32.8% |
| Contains more Vitamin KVitamin K | +33.3% |
All nutrients comparison - raw data values
| Nutrient |  |
 |
DV% diff. |
| Selenium | 19.8µg | 6.5µg | 24% |
| Magnesium | 24mg | 48mg | 6% |
| Vitamin E | 0.77mg | 0.58mg | 1% |
| Calories | 386kcal | 386kcal | 0% |
| Protein | 5.5g | 5.5g | 0% |
| Protein per 100 calories | 1.4g | 1.4g | N/A |
| Calories per 10 g protein | 702kcal | 702kcal | N/A |
| Weight per 100 calories | 26g | 26g | N/A |
| Fats | 4.3g | 4.3g | 0% |
| Unsaturated / Saturated Fat ratio | 7 | 7 | N/A |
| Vitamin C | 18.2mg | 18.2mg | 0% |
| Net carbs | 81.2g | 81.2g | N/A |
| Carbs | 85.4g | 85.4g | 0% |
| Vitamin D* | 121 IU | 121 IU | 0% |
| Vitamin D | 3µg | 3µg | 0% |
| Calcium | 303mg | 303mg | 0% |
| Potassium | 163mg | 163mg | 0% |
| Iron | 13.6mg | 13.6mg | 0% |
| Sugar | 27.29g | 27.29g | N/A |
| Fiber | 4.2g | 4.2g | 0% |
| Copper | 0.129mg | 0.129mg | 0% |
| Zinc | 11.39mg | 11.39mg | 0% |
| Phosphorus | 182mg | 182mg | 0% |
| Sodium | 458mg | 458mg | 0% |
| Vitamin A | 420µg | 421µg | 0% |
| Vitamin B1 | 1.1mg | 1.1mg | 0% |
| Vitamin B2 | 1.29mg | 1.29mg | 0% |
| Vitamin B3 | 15.19mg | 15.19mg | 0% |
| Vitamin B6 | 1.51mg | 1.51mg | 0% |
| Vitamin B12 | 4.5µg | 4.5µg | 0% |
| Vitamin K | 1.2µg | 1.6µg | 0% |
| Folate | 303µg | 303µg | 0% |
| Choline | 10.9mg | 10.9mg | 0% |
| Saturated fat | 0.5g | 0.5g | 0% |
| Monounsaturated fat | 2.09g | 2.09g | 0% |
| Polyunsaturated fat | 1.39g | 1.39g | 0% |
Macronutrient Comparison
Macronutrient breakdown side-by-side comparison
Protein:
5.5 g
Fats:
4.3 g
Carbs:
85.4 g
Water:
1.89 g
Other:
2.91 g
Protein:
5.5 g
Fats:
4.3 g
Carbs:
85.4 g
Water:
1.89 g
Other:
2.91 g
~equal in
Protein
~5.5g
~equal in
Fats
~4.3g
~equal in
Carbs
~85.4g
~equal in
Water
~1.89g
~equal in
Other
~2.91g
Fat Type Comparison
Fat type breakdown side-by-side comparison
Saturated fat:
Sat. Fat
0.5 g
Monounsaturated fat:
Mono. Fat
2.09 g
Polyunsaturated fat:
Poly. Fat
1.39 g
Saturated fat:
Sat. Fat
0.5 g
Monounsaturated fat:
Mono. Fat
2.09 g
Polyunsaturated fat:
Poly. Fat
1.39 g
~equal in
Saturated fat
~0.5g
~equal in
Monounsaturated fat
~2.09g
~equal in
Polyunsaturated fat
~1.39g


