Goat cheese vs. Blue cheese — Health Impact and Nutrition Comparison


Summary
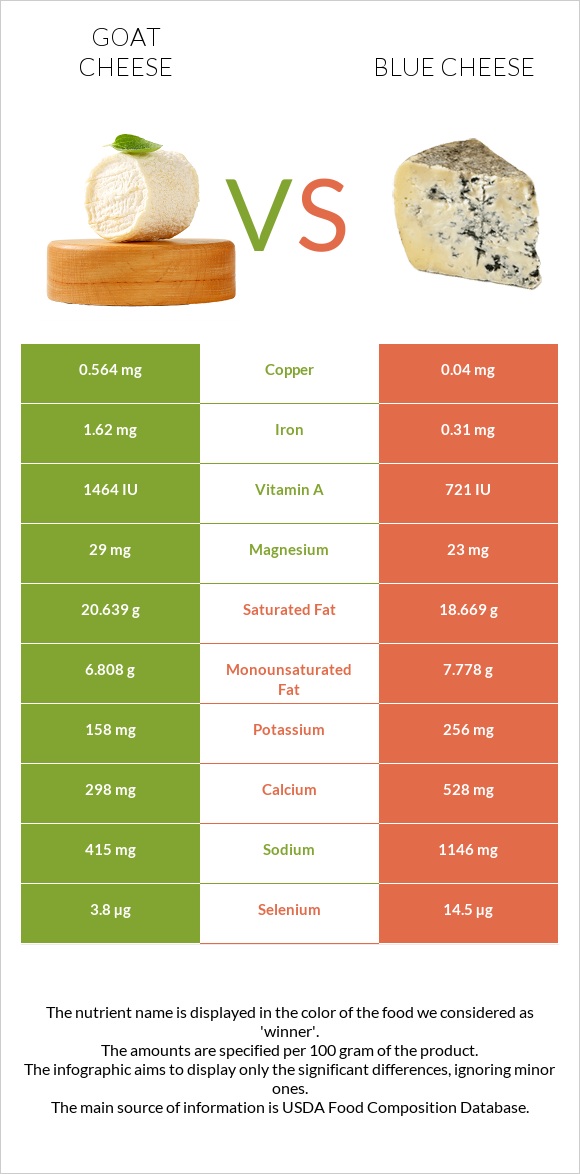
Goat cheese is higher in calories and fats. Blue cheese is richer in calcium, zinc, and potassium, vitamins B5 and B12. Goat cheese contains higher amounts of carbs and phosphorus and is richer in vitamin A.
Introduction
In this article, we will compare two kinds of cheese: goat cheese(1) and blue cheese(2). We will discuss the differences between them regarding their health impact and nutritional composition.
Nutrition
Calories
Goat cheese and blue cheese are classified as moderate-calorie foods. However, goat cheese is a bit richer in calories than blue cheese.
Carbs
Both goat cheese and blue cheese are considered low-carb foods. Blue cheese is higher in carbs than goat cheese: it provides 2.34g of carbs, while goat cheese has only 0.12g.
Fats
Goat cheese is higher in fat than blue cheese.
Saturated fats
Goat cheese is 2g richer in saturated fats compared to blue cheese.
Cholesterol
Goat cheese and blue cheese contain notable amounts of cholesterol. Blue cheese is a little lower in cholesterol.
Protein
Goat cheese and blue cheese contain nearly the same amount of protein. However, goat cheese is slightly higher in protein.
Minerals
Both these foods have nearly similar amounts of minerals. They are both rich in phosphorus. However, blue cheese is richer in calcium, zinc, and potassium than goat cheese. Goat cheese covers 61% of the DV of iron, while blue cheese covers only 12% of it.
Mineral Comparison
Contains
more
MagnesiumMagnesium
+26.1%
Contains
more
IronIron
+422.6%
Contains
more
CopperCopper
+1310%
Contains
less
SodiumSodium
-63.8%
Contains
more
ManganeseManganese
+933.3%
Contains
more
CalciumCalcium
+77.2%
Contains
more
PotassiumPotassium
+62%
Contains
more
ZincZinc
+303%
Contains
more
SeleniumSelenium
+281.6%
Vitamins
Goat cheese is richer in vitamins B1, B2, B3, and A. In comparison, blue cheese is richer in vitamins B5, B6, and B12.
The diagram below shows the difference between their vitamin profiles.
Vitamin Comparison
Contains
more
Vitamin AVitamin A
+105.6%
Contains
more
Vitamin B1Vitamin B1
+148.3%
Contains
more
Vitamin B2Vitamin B2
+77%
Contains
more
Vitamin B3Vitamin B3
+13%
Contains
more
Vitamin B5Vitamin B5
+810%
Contains
more
Vitamin B6Vitamin B6
+176.7%
Contains
more
Vitamin B12Vitamin B12
+454.5%
Contains
more
FolateFolate
+1700%
Health impact
Bone health
Blue cheese and goat cheese are good sources of calcium - a mineral that is very important for bone health (3). Calcium deficiency can lead to bone weakness and an increased risk of osteoporosis (4).
The varieties of Penicillium used for making blue cheese are safe to consume because they do not produce toxins harmful to the human body (5).
Gut health
Goat cheese contains a variety of probiotics, especially L. plantarum and L. acidophilus (6).
Diets rich in probiotics promote digestive health and boost immunity (7).
References
- https://fdc.nal.usda.gov/fdc-app.html#/food-details/173433/nutrients
- https://fdc.nal.usda.gov/fdc-app.html#/food-details/172175/nutrients
- https://www.ncbi.nlm.nih.gov/pmc/articles/PMC3330619/
- https://ods.od.nih.gov/factsheets/Calcium-HealthProfessional/
- https://pubmed.ncbi.nlm.nih.gov/24990763/
- https://pubmed.ncbi.nlm.nih.gov/28631434/
- https://pubmed.ncbi.nlm.nih.gov/23894906/

Infographic
All nutrients comparison - raw data values
| Nutrient | |
|
DV% diff. |
| Copper | 0.564mg | 0.04mg | 58% |
| Vitamin B12 | 0.22µg | 1.22µg | 42% |
| Sodium | 415mg | 1146mg | 32% |
| Vitamin B5 | 0.19mg | 1.729mg | 31% |
| Calcium | 298mg | 528mg | 23% |
| Vitamin A | 407µg | 198µg | 23% |
| Vitamin B2 | 0.676mg | 0.382mg | 23% |
| Selenium | 3.8µg | 14.5µg | 19% |
| Zinc | 0.66mg | 2.66mg | 18% |
| Iron | 1.62mg | 0.31mg | 16% |
| Folate | 2µg | 36µg | 9% |
| Saturated fat | 20.639g | 18.669g | 9% |
| Vitamin B6 | 0.06mg | 0.166mg | 8% |
| Manganese | 0.093mg | 0.009mg | 4% |
| Vitamin B1 | 0.072mg | 0.029mg | 4% |
| Potassium | 158mg | 256mg | 3% |
| Fats | 29.84g | 28.74g | 2% |
| Phosphorus | 375mg | 387mg | 2% |
| Monounsaturated fat | 6.808g | 7.778g | 2% |
| Calories | 364kcal | 353kcal | 1% |
| Carbs | 0.12g | 2.34g | 1% |
| Cholesterol | 79mg | 75mg | 1% |
| Magnesium | 29mg | 23mg | 1% |
| Vitamin B3 | 1.148mg | 1.016mg | 1% |
| Polyunsaturated fat | 0.709g | 0.8g | 1% |
| Protein | 21.58g | 21.4g | 0% |
| Protein per 100 calories | 5.9g | 6.1g | N/A |
| Calories per 10 g protein | 169kcal | 165kcal | N/A |
| Weight per 100 calories | 27g | 28g | N/A |
| Unsaturated / Saturated Fat ratio | 0.36 | 0.46 | N/A |
| Net carbs | 0.12g | 2.34g | N/A |
| Vitamin D* | 22 IU | 21 IU | 0% |
| Vitamin D | 0.5µg | 0.5µg | 0% |
| Sugar | 0.12g | 0.5g | N/A |
| Vitamin E | 0.26mg | 0.25mg | 0% |
| Vitamin K | 2.5µg | 2.4µg | 0% |
| Choline | 15.4mg | 15.4mg | 0% |
| Tryptophan | 0.227mg | 0.312mg | 0% |
| Threonine | 0.805mg | 0.785mg | 0% |
| Isoleucine | 0.893mg | 1.124mg | 0% |
| Leucine | 1.861mg | 1.919mg | 0% |
| Lysine | 1.549mg | 1.852mg | 0% |
| Methionine | 0.575mg | 0.584mg | 0% |
| Phenylalanine | 0.859mg | 1.087mg | 0% |
| Valine | 1.485mg | 1.556mg | 0% |
| Histidine | 0.589mg | 0.758mg | 0% |
Macronutrient Comparison
| Contains more CarbsCarbs | +1850% |
| Contains more OtherOther | +73.8% |
Fat Type Comparison
| Contains more Mono. FatMonounsaturated fat | +14.2% |
| Contains more Poly. FatPolyunsaturated fat | +12.8% |
People also compare


References
All the values for which the sources are not specified explicitly are taken from FDA’s Food Central. The exact link to the food presented on this page can be found below.
- Goat cheese - https://fdc.nal.usda.gov/fdc-app.html#/food-details/173433/nutrients
- Blue cheese - https://fdc.nal.usda.gov/fdc-app.html#/food-details/172175/nutrients
All the Daily Values are presented for males aged 31-50, for 2000-calorie diets.