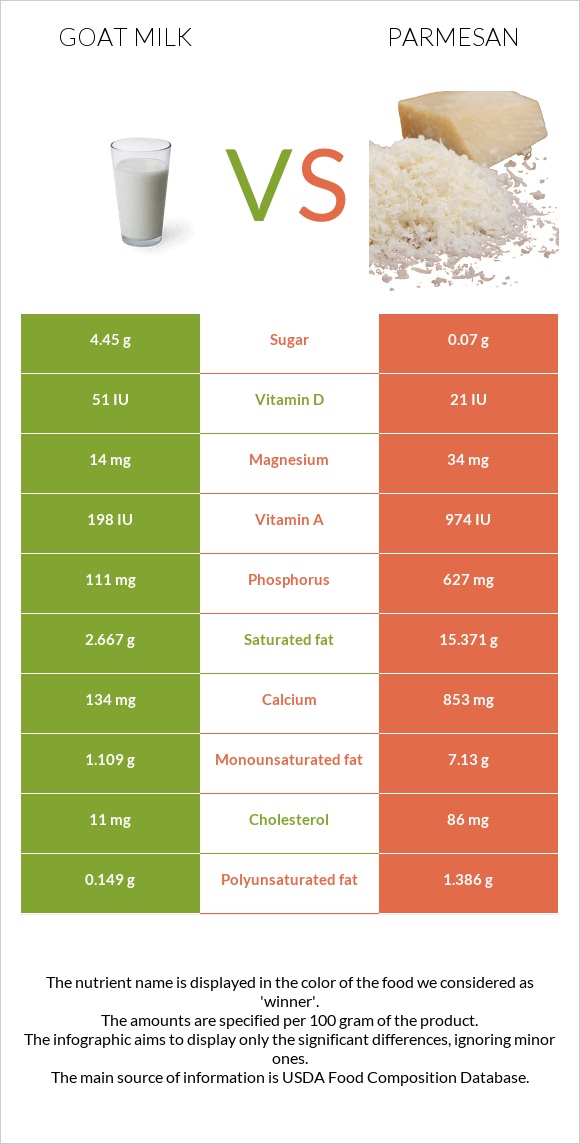
How are goat milk and parmesan different? Parmesan is higher than goat milk in phosphorus, calcium, selenium, vitamin B12, zinc, vitamin B2, and vitamin A. Parmesan covers your daily need for sodium, 76% more than goat milk. Goat milk is lower in saturated fat. Milk, goat, fluid, with added vitamin D and Cheese, parmesan, grated types were used in this article.
Infographic
Mineral Comparison
Mineral comparison score is based on the number of minerals by which one or the other food is richer. The "coverage" charts below show how much of the daily needs can be covered by 300 grams of the food.
3
100 g
300 g
1 fl oz - 30.5g 1 cup - 244g 1 quart - 976g
Magnesium
Magnesium
Calcium
Calcium
Potassium
Potassium
Iron
Iron
Copper
Copper
Zinc
Zinc
Phosphorus
Phosphorus
Sodium
Sodium
Manganese
Manganese
Selenium
Selenium
10%
40%
18%
1.9%
15%
8.2%
48%
6.5%
2.3%
7.6%
7
100 g
300 g
1 tbsp - 5g 1 oz - 28.35g
Magnesium
Magnesium
Calcium
Calcium
Potassium
Potassium
Iron
Iron
Copper
Copper
Zinc
Zinc
Phosphorus
Phosphorus
Sodium
Sodium
Manganese
Manganese
Selenium
Selenium
24%
256%
16%
18%
13%
115%
269%
235%
9.3%
188%
Vitamin Comparison
Vitamin comparison score is based on the number of vitamins by which one or the other food is richer. The "coverage" charts below show how much of the daily needs can be covered by 300 grams of the food.
4
100 g
300 g
1 fl oz - 30.5g 1 cup - 244g 1 quart - 976g
Vitamin C
Vit. C
Vitamin D
Vit. D
Vitamin A
Vit. A
Vitamin E
Vit. E
Vitamin B1
Vit. B1
Vitamin B2
Vit. B2
Vitamin B3
Vit. B3
Vitamin B5
Vit. B5
Vitamin B6
Vit. B6
Vitamin B12
Vit. B12
Vitamin K
Vit. K
Folate
Folate
4.3%
20%
19%
1.4%
12%
32%
5.2%
19%
11%
8.8%
0.75%
0.75%
8
100 g
300 g
1 tbsp - 5g 1 oz - 28.35g
Vitamin C
Vit. C
Vitamin D
Vit. D
Vitamin A
Vit. A
Vitamin E
Vit. E
Vitamin B1
Vit. B1
Vitamin B2
Vit. B2
Vitamin B3
Vit. B3
Vitamin B5
Vit. B5
Vitamin B6
Vit. B6
Vitamin B12
Vit. B12
Vitamin K
Vit. K
Folate
Folate
0%
7.5%
87%
11%
6.5%
83%
1.5%
27%
19%
175%
4.3%
4.5%
All nutrients comparison - raw data values
Nutrient
DV% diff.
Sodium
50mg
1804mg
76%
Phosphorus
111mg
627mg
74%
Calcium
134mg
853mg
72%
Selenium
1.4µg
34.4µg
60%
Saturated fat
2.667g
15.371g
58%
Vitamin B12
0.07µg
1.4µg
55%
Protein
3.56g
28.42g
50%
Fats
4.14g
27.84g
36%
Zinc
0.3mg
4.2mg
35%
Cholesterol
11mg
86mg
25%
Vitamin A
57µg
262µg
23%
Calories
69kcal
420kcal
18%
Vitamin B2
0.138mg
0.358mg
17%
Monounsaturated fat
1.109g
7.13g
15%
Polyunsaturated fat
0.149g
1.386g
8%
Iron
0.05mg
0.49mg
6%
Magnesium
14mg
34mg
5%
Vitamin D*
51 IU
21 IU
4%
Vitamin D
1.3µg
0.5µg
4%
Carbs
4.45g
13.91g
3%
Vitamin E
0.07mg
0.53mg
3%
Vitamin B5
0.31mg
0.45mg
3%
Vitamin B6
0.046mg
0.081mg
3%
Manganese
0.018mg
0.071mg
2%
Vitamin B1
0.048mg
0.026mg
2%
Vitamin C
1.3mg
0mg
1%
Potassium
204mg
180mg
1%
Copper
0.046mg
0.04mg
1%
Vitamin B3
0.277mg
0.08mg
1%
Vitamin K
0.3µg
1.7µg
1%
Folate
1µg
6µg
1%
Protein per 100 calories
5.2g
6.8g
N/A
Calories per 10 g protein
194kcal
148kcal
N/A
Weight per 100 calories
145g
24g
N/A
Unsaturated / Saturated Fat ratio
0.47
0.55
N/A
Net carbs
4.45g
13.91g
N/A
Sugar
4.45g
0.07g
N/A
Trans fat
0.876g
N/A
Choline
16mg
14.1mg
0%
Tryptophan
0.044mg
0.383mg
0%
Threonine
0.163mg
1.075mg
0%
Isoleucine
0.207mg
1.455mg
0%
Leucine
0.314mg
2.747mg
0%
Lysine
0.29mg
2.201mg
0%
Methionine
0.08mg
0.751mg
0%
Phenylalanine
0.155mg
1.538mg
0%
Valine
0.24mg
1.865mg
0%
Histidine
0.089mg
0.806mg
0%
Omega-3 - ALA
0.102g
N/A
Omega-3 - DPA
0g
0.015g
N/A
Omega-3 - Eicosatrienoic acid
0.002g
N/A
Omega-6 - Gamma-linoleic acid
0.002g
N/A
Omega-6 - Dihomo-gamma-linoleic acid
0.026g
N/A
Omega-6 - Eicosadienoic acid
0.006g
N/A
Omega-6 - Linoleic acid
0.87g
N/A
Macronutrient Comparison
Macronutrient breakdown side-by-side comparison
1
4%
4%
4%
87%
Protein:
3.56 g
Fats:
4.14 g
Carbs:
4.45 g
Water:
87.03 g
Other:
0.82 g
4
28%
28%
14%
23%
7%
Protein:
28.42 g
Fats:
27.84 g
Carbs:
13.91 g
Water:
22.65 g
Other:
7.18 g
Contains
more
Water Water
+284.2%
Contains
more
Protein Protein
+698.3%
Contains
more
Fats Fats
+572.5%
Contains
more
Carbs Carbs
+212.6%
Contains
more
Other Other
+775.6%
Fat Type Comparison
Fat type breakdown side-by-side comparison
1
68%
28%
4%
Saturated fat:
Sat. Fat
2.667 g
Monounsaturated fat:
Mono. Fat
1.109 g
Polyunsaturated fat:
Poly. Fat
0.149 g
2
64%
30%
6%
Saturated fat:
Sat. Fat
15.371 g
Monounsaturated fat:
Mono. Fat
7.13 g
Polyunsaturated fat:
Poly. Fat
1.386 g
Contains
less
Sat. Fat Saturated fat
-82.6%
Contains
more
Mono. Fat Monounsaturated fat
+542.9%
Contains
more
Poly. Fat Polyunsaturated fat
+830.2%