Goobers vs. Cocoa bean — In-Depth Nutrition Comparison
Compare
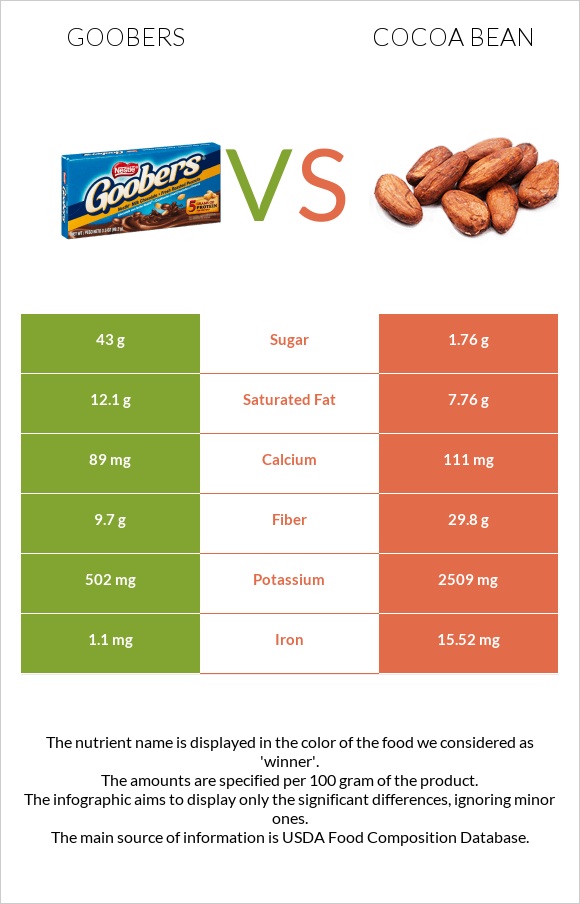
Differences between goobers and cocoa bean
- Goobers contain less iron, fiber, and potassium than cocoa bean.
- Cocoa bean's daily need coverage for iron is 180% higher.
- Cocoa bean contains 24 times less sugar than goobers. Goobers contain 43g of sugar, while cocoa bean contains 1.76g.
The food types used in this comparison are Candies, NESTLE, GOOBERS Chocolate Covered Peanuts and Cocoa, dry powder, unsweetened, processed with alkali.
Infographic
Infographic link
Mineral Comparison
Mineral comparison score is based on the number of minerals by which one or the other food is richer. The "coverage" charts below show how much of the daily needs can be covered by 300 grams of the food.
| Contains more CalciumCalcium | +24.7% |
| Contains more PotassiumPotassium | +399.8% |
| Contains more IronIron | +1310.9% |
| Contains less SodiumSodium | -47.2% |
Vitamin Comparison
Vitamin comparison score is based on the number of vitamins by which one or the other food is richer. The "coverage" charts below show how much of the daily needs can be covered by 300 grams of the food.
| Contains more Vitamin CVitamin C | +∞% |
All nutrients comparison - raw data values
| Nutrient |  |
 |
DV% diff. |
| Copper | 3.607mg | 401% | |
| Iron | 1.1mg | 15.52mg | 180% |
| Manganese | 3.737mg | 162% | |
| Magnesium | 476mg | 113% | |
| Phosphorus | 728mg | 104% | |
| Fiber | 9.7g | 29.8g | 80% |
| Potassium | 502mg | 2509mg | 59% |
| Zinc | 6.37mg | 58% | |
| Vitamin B2 | 0.46mg | 35% | |
| Fats | 34g | 13.1g | 32% |
| Selenium | 13.2µg | 24% | |
| Saturated fat | 12.1g | 7.76g | 20% |
| Caffeine | 78mg | 20% | |
| Protein | 9.7g | 18.1g | 17% |
| Calories | 512kcal | 220kcal | 15% |
| Vitamin B3 | 2.4mg | 15% | |
| Monounsaturated fat | 4.39g | 11% | |
| Vitamin B1 | 0.11mg | 9% | |
| Vitamin B6 | 0.118mg | 9% | |
| Folate | 32µg | 8% | |
| Vitamin B5 | 0.254mg | 5% | |
| Cholesterol | 12mg | 0mg | 4% |
| Polyunsaturated fat | 0.42g | 3% | |
| Carbs | 53g | 58.3g | 2% |
| Calcium | 89mg | 111mg | 2% |
| Vitamin K | 2.4µg | 2% | |
| Choline | 11.4mg | 2% | |
| Sodium | 36mg | 19mg | 1% |
| Vitamin E | 0.1mg | 1% | |
| Protein per 100 calories | 1.9g | 8.2g | N/A |
| Calories per 10 g protein | 528kcal | 122kcal | N/A |
| Weight per 100 calories | 20g | 45g | N/A |
| Unsaturated / Saturated Fat ratio | 0 | 0.62 | N/A |
| Vitamin C | 0.3mg | 0mg | 0% |
| Net carbs | 43.3g | 28.5g | N/A |
| Sugar | 43g | 1.76g | N/A |
| Trans fat | 0.07g | N/A | |
| Tryptophan | 0.271mg | 0% | |
| Threonine | 0.716mg | 0% | |
| Isoleucine | 0.701mg | 0% | |
| Leucine | 1.097mg | 0% | |
| Lysine | 0.907mg | 0% | |
| Methionine | 0.187mg | 0% | |
| Phenylalanine | 0.869mg | 0% | |
| Valine | 1.086mg | 0% | |
| Histidine | 0.312mg | 0% |
Macronutrient Comparison
Macronutrient breakdown side-by-side comparison
Protein:
9.7 g
Fats:
34 g
Carbs:
53 g
Water:
1.9 g
Other:
1.4 g
Protein:
18.1 g
Fats:
13.1 g
Carbs:
58.3 g
Water:
2.7 g
Other:
7.8 g
| Contains more FatsFats | +159.5% |
| Contains more ProteinProtein | +86.6% |
| Contains more WaterWater | +42.1% |
| Contains more OtherOther | +457.1% |
~equal in
Carbs
~58.3g
Fat Type Comparison
Fat type breakdown side-by-side comparison
Saturated fat:
Sat. Fat
12.1 g
Monounsaturated fat:
Mono. Fat
0 g
Polyunsaturated fat:
Poly. Fat
0 g
Saturated fat:
Sat. Fat
7.76 g
Monounsaturated fat:
Mono. Fat
4.39 g
Polyunsaturated fat:
Poly. Fat
0.42 g
| Contains less Sat. FatSaturated fat | -35.9% |


