Infographic
Mineral Comparison
Mineral comparison score is based on the number of minerals by which one or the other food is richer. The "coverage" charts below show how much of the daily needs can be covered by 300 grams of the food.
9
100 g
300 g
1 grape - 2.4g 1 cup - 92g
Magnesium
Magnesium
Calcium
Calcium
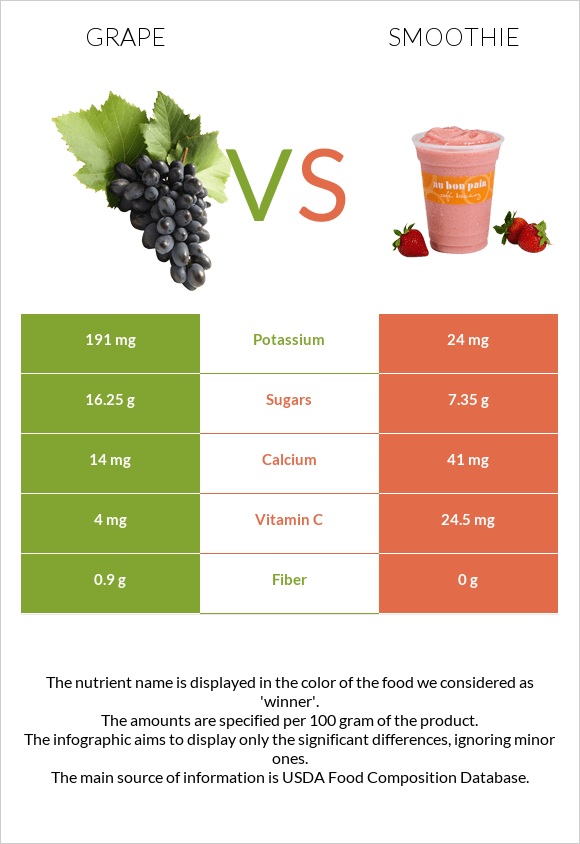
Potassium
Potassium
Iron
Iron
Copper
Copper
Zinc
Zinc
Phosphorus
Phosphorus
Sodium
Sodium
Manganese
Manganese
Selenium
Selenium
3.6%
4.2%
17%
11%
13%
1.1%
4.3%
0.26%
94%
0.55%
1
100 g
300 g
1 serving 8 oz - 245g
Magnesium
Magnesium
Calcium
Calcium
Potassium
Potassium
Iron
Iron
Copper
Copper
Zinc
Zinc
Phosphorus
Phosphorus
Sodium
Sodium
Manganese
Manganese
Selenium
Selenium
0%
12%
2.1%
5.6%
0%
0%
0%
3.8%
0%
0%
Vitamin Comparison
Vitamin comparison score is based on the number of vitamins by which one or the other food is richer. The "coverage" charts below show how much of the daily needs can be covered by 300 grams of the food.
8
100 g
300 g
1 grape - 2.4g 1 cup - 92g
Vitamin C
Vit. C
Vitamin D
Vit. D
Vitamin A
Vit. A
Vitamin E
Vit. E
Vitamin B1
Vit. B1
Vitamin B2
Vit. B2
Vitamin B3
Vit. B3
Vitamin B5
Vit. B5
Vitamin B6
Vit. B6
Vitamin B12
Vit. B12
Vitamin K
Vit. K
Folate
Folate
13%
0%
1.7%
3.8%
23%
13%
5.6%
1.4%
25%
0%
37%
3%
3
100 g
300 g
1 serving 8 oz - 245g
Vitamin C
Vit. C
Vitamin D
Vit. D
Vitamin A
Vit. A
Vitamin E
Vit. E
Vitamin B1
Vit. B1
Vitamin B2
Vit. B2
Vitamin B3
Vit. B3
Vitamin B5
Vit. B5
Vitamin B6
Vit. B6
Vitamin B12
Vit. B12
Vitamin K
Vit. K
Folate
Folate
82%
0%
0%
0%
0%
0%
15%
0%
19%
30%
0%
0%
All nutrients comparison - raw data values
Nutrient
DV% diff.
Manganese
0.718mg
31%
Vitamin C
4mg
24.5mg
23%
Vitamin K
14.6µg
12%
Vitamin B12
0µg
0.24µg
10%
Vitamin B1
0.092mg
8%
Potassium
191mg
24mg
5%
Fiber
0.9g
0g
4%
Copper
0.04mg
4%
Vitamin B2
0.057mg
4%
Carbs
17.15g
8.16g
3%
Calcium
14mg
41mg
3%
Vitamin B3
0.3mg
0.816mg
3%
Calories
67kcal
37kcal
2%
Iron
0.29mg
0.15mg
2%
Vitamin B6
0.11mg
0.082mg
2%
Protein
0.63g
1.22g
1%
Fats
0.35g
0g
1%
Magnesium
5mg
1%
Phosphorus
10mg
1%
Sodium
2mg
29mg
1%
Vitamin A
5µg
1%
Vitamin E
0.19mg
1%
Folate
4µg
1%
Choline
5.6mg
1%
Saturated fat
0.114g
0g
1%
Polyunsaturated fat
0.102g
1%
Protein per 100 calories
0.94g
3.3g
N/A
Calories per 10 g protein
1063kcal
303kcal
N/A
Weight per 100 calories
149g
270g
N/A
Net carbs
16.25g
8.16g
N/A
Sugar
16.25g
7.35g
N/A
Zinc
0.04mg
0%
Selenium
0.1µg
0%
Vitamin B5
0.024mg
0%
Monounsaturated fat
0.014g
0%
Tryptophan
0.003mg
0%
Threonine
0.017mg
0%
Isoleucine
0.005mg
0%
Leucine
0.013mg
0%
Lysine
0.014mg
0%
Methionine
0.021mg
0%
Phenylalanine
0.013mg
0%
Valine
0.017mg
0%
Histidine
0.023mg
0%
Macronutrient Comparison
Macronutrient breakdown side-by-side comparison
3
17%
81%
Protein:
0.63 g
Fats:
0.35 g
Carbs:
17.15 g
Water:
81.3 g
Other:
0.57 g
2
8%
90%
Protein:
1.22 g
Fats:
0 g
Carbs:
8.16 g
Water:
90.28 g
Other:
0.34 g
Contains
more
Fats Fats
+∞%
Contains
more
Carbs Carbs
+110.2%
Contains
more
Other Other
+67.6%
Contains
more
Protein Protein
+93.7%
Contains
more
Water Water
+11%