A recap on the differences between gratin and pretzels Gratin has more vitamin C and calcium; however, pretzels are higher in manganese, folate, iron, copper, and vitamin B1. Pretzels cover your daily manganese needs 71% more than gratin. Pretzels have less cholesterol. Food varieties used in this article are Potatoes, au gratin, home-prepared from recipe using butter and Snacks, pretzels, hard, plain, made with unenriched flour, salted .
Infographic
Mineral Comparison
Mineral comparison score is based on the number of minerals by which one or the other food is richer. The "coverage" charts below show how much of the daily needs can be covered by 300 grams of the food.
3
100 g
300 g
1 cup - 245g
Magnesium
Magnesium
Calcium
Calcium
Potassium
Potassium
Iron
Iron
Copper
Copper
Zinc
Zinc
Phosphorus
Phosphorus
Sodium
Sodium
Manganese
Manganese
Selenium
Selenium
14%
36%
35%
24%
53%
19%
48%
56%
21%
15%
6
100 g
300 g
1 oz - 28.35g 10 twists - 60g
Magnesium
Magnesium
Calcium
Calcium
Potassium
Potassium
Iron
Iron
Copper
Copper
Zinc
Zinc
Phosphorus
Phosphorus
Sodium
Sodium
Manganese
Manganese
Selenium
Selenium
25%
11%
13%
63%
88%
23%
48%
224%
233%
32%
Vitamin Comparison
Vitamin comparison score is based on the number of vitamins by which one or the other food is richer. The "coverage" charts below show how much of the daily needs can be covered by 300 grams of the food.
5
100 g
300 g
1 cup - 245g
Vitamin C
Vit. C
Vitamin D
Vit. D
Vitamin A
Vit. A
Vitamin E
Vit. E
Vitamin B1
Vit. B1
Vitamin B2
Vit. B2
Vitamin B3
Vit. B3
Vitamin B5
Vit. B5
Vitamin B6
Vit. B6
Vitamin B12
Vit. B12
Vitamin K
Vit. K
Folate
Folate
33%
0%
21%
0%
16%
27%
19%
23%
40%
0%
0%
8.3%
3
100 g
300 g
1 oz - 28.35g 10 twists - 60g
Vitamin C
Vit. C
Vitamin D
Vit. D
Vitamin A
Vit. A
Vitamin E
Vit. E
Vitamin B1
Vit. B1
Vitamin B2
Vit. B2
Vitamin B3
Vit. B3
Vitamin B5
Vit. B5
Vitamin B6
Vit. B6
Vitamin B12
Vit. B12
Vitamin K
Vit. K
Folate
Folate
0%
0%
0%
0%
45%
23%
36%
17%
27%
0%
0%
62%
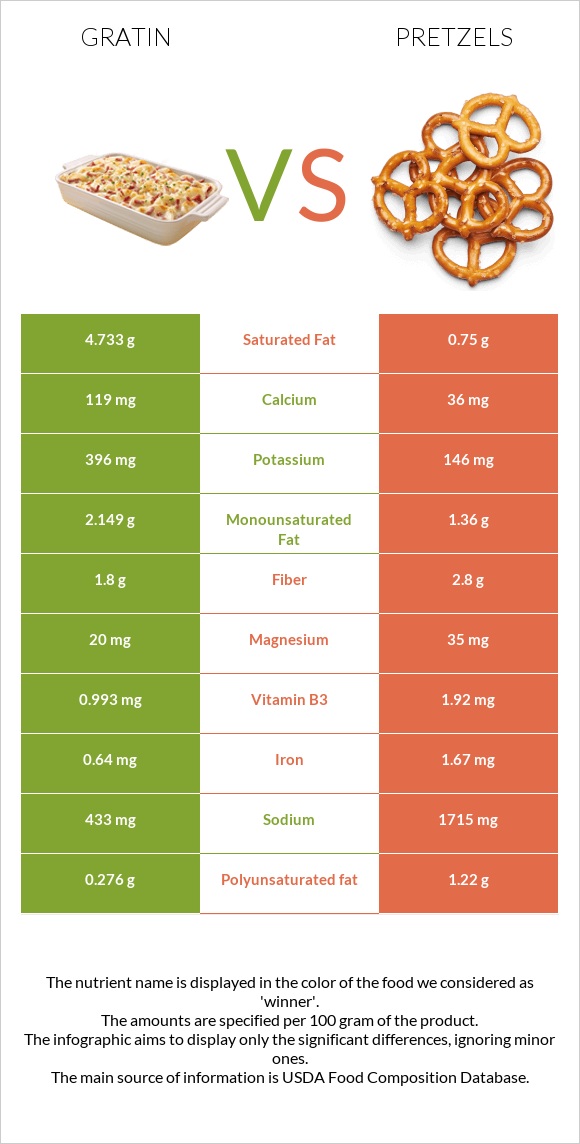
All nutrients comparison - raw data values
Nutrient
DV% diff.
Manganese
0.161mg
1.789mg
71%
Sodium
433mg
1715mg
56%
Carbs
11.27g
79.2g
23%
Folate
11µg
83µg
18%
Saturated fat
4.733g
0.75g
18%
Iron
0.64mg
1.67mg
13%
Calories
132kcal
381kcal
12%
Copper
0.16mg
0.264mg
12%
Vitamin C
9.9mg
0mg
11%
Vitamin B1
0.064mg
0.18mg
10%
Protein
5.06g
9.1g
8%
Cholesterol
23mg
0mg
8%
Calcium
119mg
36mg
8%
Potassium
396mg
146mg
7%
Vitamin A
64µg
0µg
7%
Fats
7.59g
3.5g
6%
Selenium
2.7µg
5.8µg
6%
Vitamin B3
0.993mg
1.92mg
6%
Polyunsaturated fat
0.276g
1.22g
6%
Magnesium
20mg
35mg
4%
Fiber
1.8g
2.8g
4%
Vitamin B6
0.174mg
0.116mg
4%
Vitamin B5
0.387mg
0.288mg
2%
Monounsaturated fat
2.149g
1.36g
2%
Zinc
0.69mg
0.85mg
1%
Vitamin B2
0.116mg
0.1mg
1%
Protein per 100 calories
3.8g
2.4g
N/A
Calories per 10 g protein
261kcal
419kcal
N/A
Weight per 100 calories
76g
26g
N/A
Unsaturated / Saturated Fat ratio
0.51
3.4
N/A
Net carbs
9.47g
76.4g
N/A
Phosphorus
113mg
113mg
0%
Tryptophan
0.07mg
0.109mg
0%
Threonine
0.192mg
0.259mg
0%
Isoleucine
0.284mg
0.345mg
0%
Leucine
0.443mg
0.636mg
0%
Lysine
0.381mg
0.221mg
0%
Methionine
0.117mg
0.164mg
0%
Phenylalanine
0.254mg
0.453mg
0%
Valine
0.325mg
0.392mg
0%
Histidine
0.151mg
0.201mg
0%
Macronutrient Comparison
Macronutrient breakdown side-by-side comparison
2
5%
8%
11%
74%
2%
Protein:
5.06 g
Fats:
7.59 g
Carbs:
11.27 g
Water:
74 g
Other:
2.08 g
3
9%
4%
79%
3%
5%
Protein:
9.1 g
Fats:
3.5 g
Carbs:
79.2 g
Water:
3.3 g
Other:
4.9 g
Contains
more
Fats Fats
+116.9%
Contains
more
Water Water
+2142.4%
Contains
more
Protein Protein
+79.8%
Contains
more
Carbs Carbs
+602.8%
Contains
more
Other Other
+135.6%
Fat Type Comparison
Fat type breakdown side-by-side comparison
1
66%
30%
4%
Saturated fat:
Sat. Fat
4.733 g
Monounsaturated fat:
Mono. Fat
2.149 g
Polyunsaturated fat:
Poly. Fat
0.276 g
2
23%
41%
37%
Saturated fat:
Sat. Fat
0.75 g
Monounsaturated fat:
Mono. Fat
1.36 g
Polyunsaturated fat:
Poly. Fat
1.22 g
Contains
more
Mono. Fat Monounsaturated fat
+58%
Contains
less
Sat. Fat Saturated fat
-84.2%
Contains
more
Poly. Fat Polyunsaturated fat
+342%