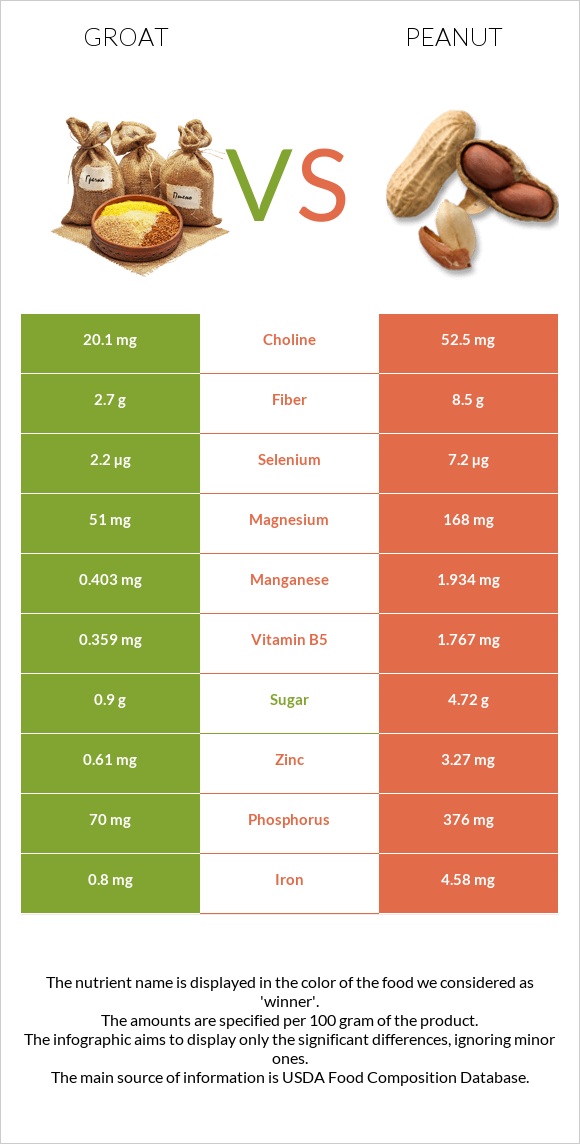
A recap on the differences between groat and peanuts Groat is higher in vitamin B2 and magnesium, yet peanuts are higher in folate, vitamin B1, vitamin B3, iron, manganese, vitamin B5, and vitamin B6. Peanuts cover your daily folate needs 53% more than groat. Groat contains 3 times more vitamin B2 than peanuts. While groat contains 0.425mg of vitamin B2, peanuts contain only 0.135mg. The amount of saturated fat in groat is lower. The glycemic index of peanuts is lower. Food varieties used in this article are Buckwheat and Peanuts, all types, raw .
Infographic
Mineral Comparison
Mineral comparison score is based on the number of minerals by which one or the other food is richer. The "coverage" charts below show how much of the daily needs can be covered by 300 grams of the food.
3
100 g
300 g
1 cup - 170g
Magnesium
Magnesium
Calcium
Calcium
Potassium
Potassium
Iron
Iron
Copper
Copper
Zinc
Zinc
Phosphorus
Phosphorus
Sodium
Sodium
Manganese
Manganese
Selenium
Selenium
165%
5.4%
41%
83%
367%
65%
149%
0.13%
170%
45%
5
100 g
300 g
1 oz - 28.35g 1 cup - 146g
Magnesium
Magnesium
Calcium
Calcium
Potassium
Potassium
Iron
Iron
Copper
Copper
Zinc
Zinc
Phosphorus
Phosphorus
Sodium
Sodium
Manganese
Manganese
Selenium
Selenium
120%
28%
62%
172%
381%
89%
161%
2.3%
252%
39%
Vitamin Comparison
Vitamin comparison score is based on the number of vitamins by which one or the other food is richer. The "coverage" charts below show how much of the daily needs can be covered by 300 grams of the food.
1
100 g
300 g
1 cup - 170g
Vitamin C
Vit. C
Vitamin D
Vit. D
Vitamin A
Vit. A
Vitamin E
Vit. E
Vitamin B1
Vit. B1
Vitamin B2
Vit. B2
Vitamin B3
Vit. B3
Vitamin B5
Vit. B5
Vitamin B6
Vit. B6
Vitamin B12
Vit. B12
Vitamin K
Vit. K
Folate
Folate
0%
0%
0%
0%
25%
98%
132%
74%
48%
0%
0%
23%
6
100 g
300 g
1 oz - 28.35g 1 cup - 146g
Vitamin C
Vit. C
Vitamin D
Vit. D
Vitamin A
Vit. A
Vitamin E
Vit. E
Vitamin B1
Vit. B1
Vitamin B2
Vit. B2
Vitamin B3
Vit. B3
Vitamin B5
Vit. B5
Vitamin B6
Vit. B6
Vitamin B12
Vit. B12
Vitamin K
Vit. K
Folate
Folate
0%
0%
0%
167%
160%
31%
226%
106%
80%
0%
0%
180%
All nutrients comparison - raw data values
Nutrient
DV% diff.
Polyunsaturated fat
1.039g
15.558g
97%
Fats
3.4g
49.24g
71%
Monounsaturated fat
1.04g
24.426g
58%
Vitamin E
8.33mg
56%
Folate
30µg
240µg
53%
Vitamin B1
0.101mg
0.64mg
45%
Vitamin B3
7.02mg
12.066mg
32%
Iron
2.2mg
4.58mg
30%
Manganese
1.3mg
1.934mg
28%
Protein
13.25g
25.8g
25%
Saturated fat
0.741g
6.279g
25%
Vitamin B2
0.425mg
0.135mg
22%
Carbs
71.5g
16.13g
18%
Magnesium
231mg
168mg
15%
Calories
343kcal
567kcal
11%
Vitamin B5
1.233mg
1.767mg
11%
Vitamin B6
0.21mg
0.348mg
11%
Choline
52.5mg
10%
Zinc
2.4mg
3.27mg
8%
Calcium
18mg
92mg
7%
Potassium
460mg
705mg
7%
Fiber
10g
8.5g
6%
Copper
1.1mg
1.144mg
5%
Phosphorus
347mg
376mg
4%
Selenium
8.3µg
7.2µg
2%
Sodium
1mg
18mg
1%
Protein per 100 calories
3.9g
4.6g
N/A
Calories per 10 g protein
259kcal
220kcal
N/A
Weight per 100 calories
29g
18g
N/A
Unsaturated / Saturated Fat ratio
2.8
6.4
N/A
Net carbs
61.5g
7.63g
N/A
Sugar
4.72g
N/A
Tryptophan
0.192mg
0.25mg
0%
Threonine
0.506mg
0.883mg
0%
Isoleucine
0.498mg
0.907mg
0%
Leucine
0.832mg
1.672mg
0%
Lysine
0.672mg
0.926mg
0%
Methionine
0.172mg
0.317mg
0%
Phenylalanine
0.52mg
1.377mg
0%
Valine
0.678mg
1.082mg
0%
Histidine
0.309mg
0.652mg
0%
Macronutrient Comparison
Macronutrient breakdown side-by-side comparison
2
13%
3%
72%
10%
2%
Protein:
13.25 g
Fats:
3.4 g
Carbs:
71.5 g
Water:
9.75 g
Other:
2.1 g
3
26%
49%
16%
7%
2%
Protein:
25.8 g
Fats:
49.24 g
Carbs:
16.13 g
Water:
6.5 g
Other:
2.33 g
Contains
more
Carbs Carbs
+343.3%
Contains
more
Water Water
+50%
Contains
more
Protein Protein
+94.7%
Contains
more
Fats Fats
+1348.2%
Contains
more
Other Other
+11%
Fat Type Comparison
Fat type breakdown side-by-side comparison
1
26%
37%
37%
Saturated fat:
Sat. Fat
0.741 g
Monounsaturated fat:
Mono. Fat
1.04 g
Polyunsaturated fat:
Poly. Fat
1.039 g
2
14%
53%
34%
Saturated fat:
Sat. Fat
6.279 g
Monounsaturated fat:
Mono. Fat
24.426 g
Polyunsaturated fat:
Poly. Fat
15.558 g
Contains
less
Sat. Fat Saturated fat
-88.2%
Contains
more
Mono. Fat Monounsaturated fat
+2248.7%
Contains
more
Poly. Fat Polyunsaturated fat
+1397.4%