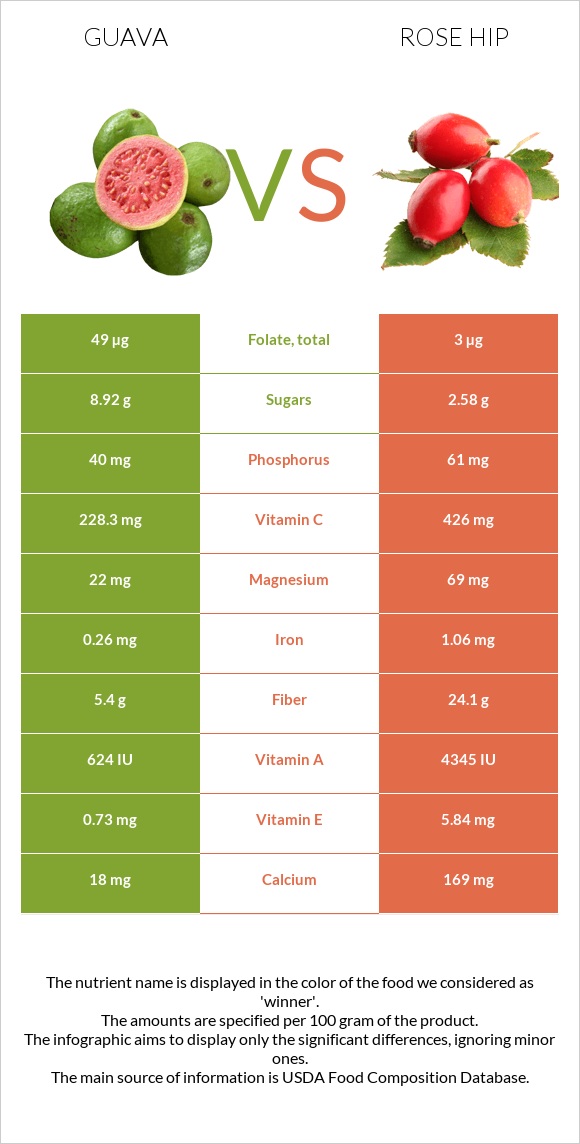
Important differences between guava and rose hips Guava has more copper and folate; however, rose hips have more vitamin C, fiber, vitamin A, manganese, vitamin E, vitamin K, calcium, and magnesium. Rose hips' daily need coverage for vitamin C is 220% more. Guava has 16 times more folate than rose hips. Guava has 49µg of folate, while rose hips have 3µg. Rose hips have a higher glycemic index than guava. The food varieties used in the comparison are Guavas, common, raw and Rose Hips, wild (Northern Plains Indians) .
Infographic
Mineral Comparison
Mineral comparison score is based on the number of minerals by which one or the other food is richer. The "coverage" charts below show how much of the daily needs can be covered by 300 grams of the food.
3
100 g
300 g
1 fruit, without refuse - 55g 1 cup - 165g
Magnesium
Magnesium
Calcium
Calcium
Potassium
Potassium
Iron
Iron
Copper
Copper
Zinc
Zinc
Phosphorus
Phosphorus
Sodium
Sodium
Manganese
Manganese
Selenium
Selenium
16%
5.4%
37%
9.8%
77%
6.3%
17%
0.26%
20%
3.3%
5
100 g
300 g
1 cup - 127g
Magnesium
Magnesium
Calcium
Calcium
Potassium
Potassium
Iron
Iron
Copper
Copper
Zinc
Zinc
Phosphorus
Phosphorus
Sodium
Sodium
Manganese
Manganese
Selenium
Selenium
49%
51%
38%
40%
38%
6.8%
26%
0.52%
133%
0%
Vitamin Comparison
Vitamin comparison score is based on the number of vitamins by which one or the other food is richer. The "coverage" charts below show how much of the daily needs can be covered by 300 grams of the food.
3
100 g
300 g
1 fruit, without refuse - 55g 1 cup - 165g
Vitamin C
Vit. C
Vitamin D
Vit. D
Vitamin A
Vit. A
Vitamin E
Vit. E
Vitamin B1
Vit. B1
Vitamin B2
Vit. B2
Vitamin B3
Vit. B3
Vitamin B5
Vit. B5
Vitamin B6
Vit. B6
Vitamin B12
Vit. B12
Vitamin K
Vit. K
Folate
Folate
761%
0%
10%
15%
17%
9.2%
20%
27%
25%
0%
6.5%
37%
7
100 g
300 g
1 cup - 127g
Vitamin C
Vit. C
Vitamin D
Vit. D
Vitamin A
Vit. A
Vitamin E
Vit. E
Vitamin B1
Vit. B1
Vitamin B2
Vit. B2
Vitamin B3
Vit. B3
Vitamin B5
Vit. B5
Vitamin B6
Vit. B6
Vitamin B12
Vit. B12
Vitamin K
Vit. K
Folate
Folate
1420%
0%
72%
117%
4%
38%
24%
48%
18%
0%
65%
2.3%
All nutrients comparison - raw data values
Nutrient
DV% diff.
Vitamin C
228.3mg
426mg
220%
Fiber
5.4g
24.1g
75%
Manganese
0.15mg
1.02mg
38%
Vitamin E
0.73mg
5.84mg
34%
Vitamin A
31µg
217µg
21%
Vitamin K
2.6µg
25.9µg
19%
Calcium
18mg
169mg
15%
Copper
0.23mg
0.113mg
13%
Folate
49µg
3µg
12%
Magnesium
22mg
69mg
11%
Iron
0.26mg
1.06mg
10%
Vitamin B2
0.04mg
0.166mg
10%
Carbs
14.32g
38.22g
8%
Vitamin B5
0.451mg
0.8mg
7%
Calories
68kcal
162kcal
5%
Vitamin B1
0.067mg
0.016mg
4%
Phosphorus
40mg
61mg
3%
Vitamin B6
0.11mg
0.076mg
3%
Polyunsaturated fat
0.401g
3%
Protein
2.55g
1.6g
2%
Fats
0.95g
0.34g
1%
Selenium
0.6µg
1%
Vitamin B3
1.084mg
1.3mg
1%
Choline
7.6mg
12mg
1%
Saturated fat
0.272g
1%
Fructose
1.16g
1%
Protein per 100 calories
3.8g
0.99g
N/A
Calories per 10 g protein
267kcal
1013kcal
N/A
Weight per 100 calories
147g
62g
N/A
Net carbs
8.92g
14.12g
N/A
Potassium
417mg
429mg
0%
Sugar
8.92g
2.58g
N/A
Zinc
0.23mg
0.25mg
0%
Sodium
2mg
4mg
0%
Monounsaturated fat
0.087g
0%
Tryptophan
0.022mg
0%
Threonine
0.096mg
0%
Isoleucine
0.093mg
0%
Leucine
0.171mg
0%
Lysine
0.072mg
0%
Methionine
0.016mg
0%
Phenylalanine
0.006mg
0%
Valine
0.087mg
0%
Histidine
0.022mg
0%
Macronutrient Comparison
Macronutrient breakdown side-by-side comparison
4
3%
14%
81%
Protein:
2.55 g
Fats:
0.95 g
Carbs:
14.32 g
Water:
80.8 g
Other:
1.38 g
1
38%
59%
Protein:
1.6 g
Fats:
0.34 g
Carbs:
38.22 g
Water:
58.66 g
Other:
1.18 g
Contains
more
Protein Protein
+59.4%
Contains
more
Fats Fats
+179.4%
Contains
more
Water Water
+37.7%
Contains
more
Other Other
+16.9%
Contains
more
Carbs Carbs
+166.9%