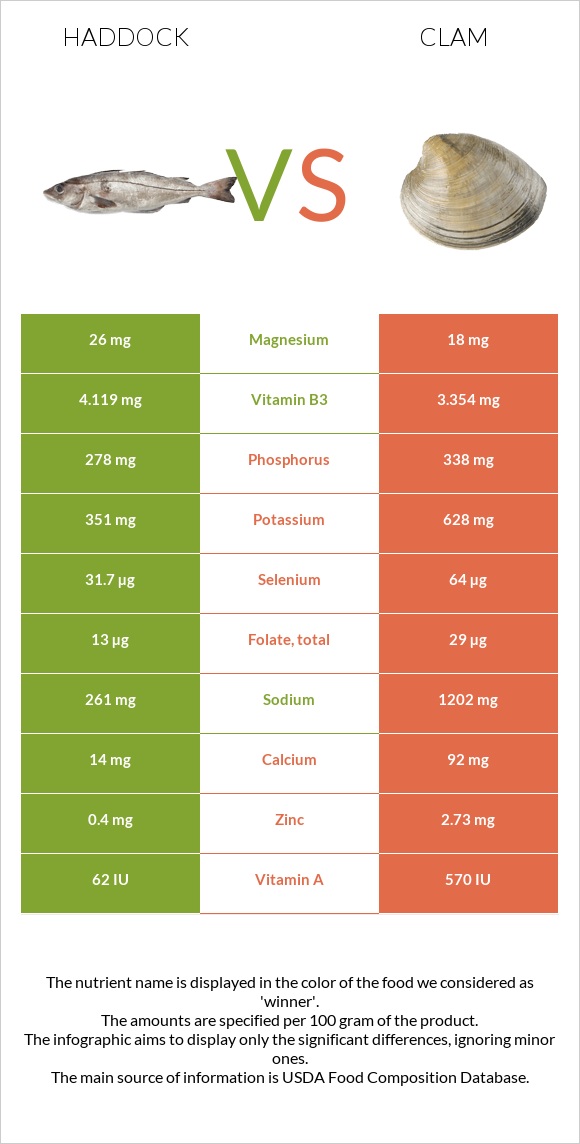
Summary of differences between haddock and clam Haddock has more vitamin B6; however, clam is higher in vitamin B12, copper, selenium, manganese, iron, vitamin B2, vitamin C, and zinc. Clam covers your daily need for vitamin B12, 4032% more than haddock. Haddock has 3 times more vitamin B6 than clam. While haddock has 0.327mg of vitamin B6, clam has only 0.11mg. Haddock has less sodium. The glycemic index of clam is higher. These are the specific foods used in this comparison Fish, haddock, cooked, dry heat and Mollusks, clam, mixed species, cooked, moist heat .
Infographic
Mineral Comparison
Mineral comparison score is based on the number of minerals by which one or the other food is richer. The "coverage" charts below show how much of the daily needs can be covered by 300 grams of the food.
2
100 g
300 g
3 oz - 85g 1 fillet - 150g
Magnesium
Magnesium
Calcium
Calcium
Potassium
Potassium
Iron
Iron
Copper
Copper
Zinc
Zinc
Phosphorus
Phosphorus
Sodium
Sodium
Manganese
Manganese
Selenium
Selenium
19%
4.2%
31%
7.9%
8.7%
11%
119%
34%
1.7%
173%
8
100 g
300 g
3 oz - 85g 20 small - 190g
Magnesium
Magnesium
Calcium
Calcium
Potassium
Potassium
Iron
Iron
Copper
Copper
Zinc
Zinc
Phosphorus
Phosphorus
Sodium
Sodium
Manganese
Manganese
Selenium
Selenium
13%
28%
55%
105%
229%
74%
145%
157%
130%
349%
Vitamin Comparison
Vitamin comparison score is based on the number of vitamins by which one or the other food is richer. The "coverage" charts below show how much of the daily needs can be covered by 300 grams of the food.
5
100 g
300 g
3 oz - 85g 1 fillet - 150g
Vitamin C
Vit. C
Vitamin D
Vit. D
Vitamin A
Vit. A
Vitamin E
Vit. E
Vitamin B1
Vit. B1
Vitamin B2
Vit. B2
Vitamin B3
Vit. B3
Vitamin B5
Vit. B5
Vitamin B6
Vit. B6
Vitamin B12
Vit. B12
Vitamin K
Vit. K
Folate
Folate
0%
9%
7%
11%
5.8%
16%
77%
30%
75%
266%
0.25%
9.8%
7
100 g
300 g
3 oz - 85g 20 small - 190g
Vitamin C
Vit. C
Vitamin D
Vit. D
Vitamin A
Vit. A
Vitamin E
Vit. E
Vitamin B1
Vit. B1
Vitamin B2
Vit. B2
Vitamin B3
Vit. B3
Vitamin B5
Vit. B5
Vitamin B6
Vit. B6
Vitamin B12
Vit. B12
Vitamin K
Vit. K
Folate
Folate
74%
0%
57%
0%
38%
98%
63%
41%
25%
12361%
0%
22%
All nutrients comparison - raw data values
Nutrient
DV% diff.
Vitamin B12
2.13µg
98.89µg
4032%
Copper
0.026mg
0.688mg
74%
Selenium
31.7µg
64µg
59%
Manganese
0.013mg
1mg
43%
Sodium
261mg
1202mg
41%
Iron
0.21mg
2.81mg
33%
Vitamin B2
0.069mg
0.426mg
27%
Vitamin C
0mg
22.1mg
25%
Zinc
0.4mg
2.73mg
21%
Vitamin A
21µg
171µg
17%
Vitamin B6
0.327mg
0.11mg
17%
Choline
79.6mg
14%
Protein
19.99g
25.55g
11%
Vitamin B1
0.023mg
0.15mg
11%
Phosphorus
278mg
338mg
9%
Calcium
14mg
92mg
8%
Potassium
351mg
628mg
8%
Vitamin B3
4.119mg
3.354mg
5%
Vitamin E
0.55mg
4%
Vitamin B5
0.494mg
0.68mg
4%
Folate
13µg
29µg
4%
Calories
90kcal
148kcal
3%
Vitamin D*
23 IU
3%
Vitamin D
0.6µg
3%
Fats
0.55g
1.95g
2%
Carbs
0g
5.13g
2%
Magnesium
26mg
18mg
2%
Polyunsaturated fat
0.204g
0.552g
2%
Protein per 100 calories
22g
17g
N/A
Calories per 10 g protein
45kcal
58kcal
N/A
Weight per 100 calories
111g
68g
N/A
Net carbs
0g
5.13g
N/A
Cholesterol
66mg
67mg
0%
Vitamin K
0.1µg
0%
Trans fat
0.005g
N/A
Saturated fat
0.111g
0.188g
0%
Monounsaturated fat
0.074g
0.172g
0%
Tryptophan
0.26mg
0.286mg
0%
Threonine
1.015mg
1.099mg
0%
Isoleucine
1.067mg
1.112mg
0%
Leucine
1.882mg
1.798mg
0%
Lysine
2.126mg
1.909mg
0%
Methionine
0.686mg
0.576mg
0%
Phenylalanine
0.904mg
0.915mg
0%
Valine
1.193mg
1.116mg
0%
Histidine
0.682mg
0.49mg
0%
Omega-3 - EPA
0.051g
0.138g
N/A
Omega-3 - DHA
0.109g
0.146g
N/A
Omega-3 - DPA
0.006g
0.104g
N/A
Omega-6 - Eicosadienoic acid
0.001g
N/A
Macronutrient Comparison
Macronutrient breakdown side-by-side comparison
1
20%
79%
Protein:
19.99 g
Fats:
0.55 g
Carbs:
0 g
Water:
79.65 g
Other:
0 g
4
26%
2%
5%
64%
4%
Protein:
25.55 g
Fats:
1.95 g
Carbs:
5.13 g
Water:
63.64 g
Other:
3.73 g
Contains
more
Water Water
+25.2%
Contains
more
Protein Protein
+27.8%
Contains
more
Fats Fats
+254.5%
Contains
more
Carbs Carbs
+∞%
Contains
more
Other Other
+∞%
Fat Type Comparison
Fat type breakdown side-by-side comparison
1
29%
19%
52%
Saturated fat:
Sat. Fat
0.111 g
Monounsaturated fat:
Mono. Fat
0.074 g
Polyunsaturated fat:
Poly. Fat
0.204 g
2
21%
19%
61%
Saturated fat:
Sat. Fat
0.188 g
Monounsaturated fat:
Mono. Fat
0.172 g
Polyunsaturated fat:
Poly. Fat
0.552 g
Contains
less
Sat. Fat Saturated fat
-41%
Contains
more
Mono. Fat Monounsaturated fat
+132.4%
Contains
more
Poly. Fat Polyunsaturated fat
+170.6%