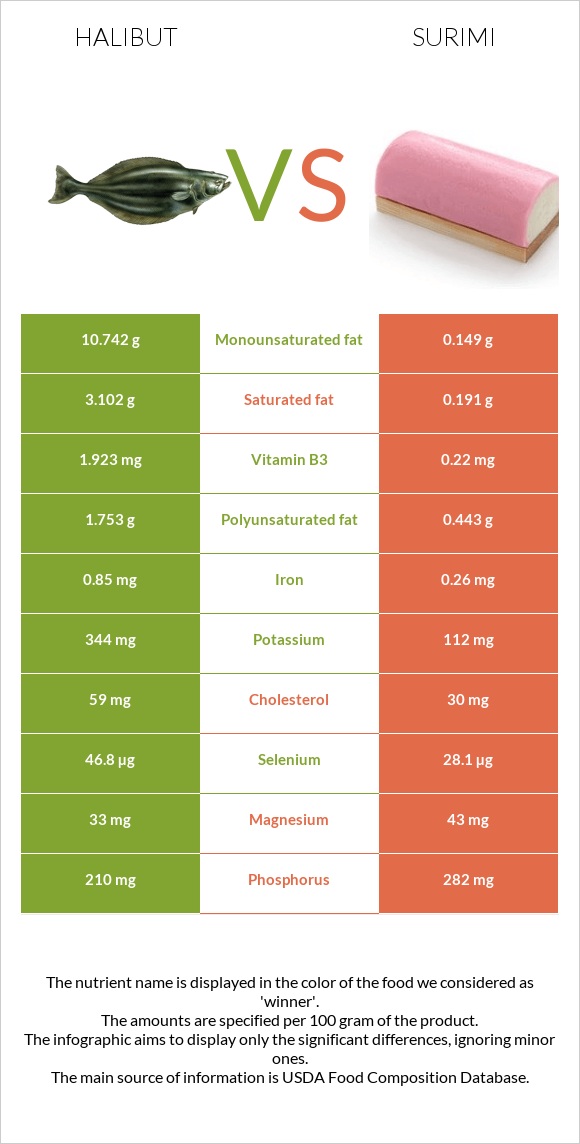
A recap on the differences between halibut and surimi Halibut is higher in vitamin B6, selenium, vitamin B3, iron, potassium, and vitamin B2, yet surimi is higher in vitamin B12 and phosphorus. Halibut covers your daily vitamin B6 needs 35% more than surimi. Halibut contains 16 times more saturated fat than surimi. While halibut contains 3.102g of saturated fat, surimi contains only 0.191g. The glycemic index of halibut is lower. Food varieties used in this article are Fish, halibut, greenland, cooked, dry heat and Fish, surimi .
Infographic
Mineral Comparison
Mineral comparison score is based on the number of minerals by which one or the other food is richer. The "coverage" charts below show how much of the daily needs can be covered by 300 grams of the food.
7
100 g
300 g
3 oz - 85g 0.5 fillet - 159g
Magnesium
Magnesium
Calcium
Calcium
Potassium
Potassium
Iron
Iron
Copper
Copper
Zinc
Zinc
Phosphorus
Phosphorus
Sodium
Sodium
Manganese
Manganese
Selenium
Selenium
24%
1.2%
30%
32%
13%
14%
90%
13%
2%
255%
3
100 g
300 g
1 oz - 28.35g 3 oz - 85g
Magnesium
Magnesium
Calcium
Calcium
Potassium
Potassium
Iron
Iron
Copper
Copper
Zinc
Zinc
Phosphorus
Phosphorus
Sodium
Sodium
Manganese
Manganese
Selenium
Selenium
31%
2.7%
9.9%
9.8%
11%
9%
121%
19%
1.4%
153%
Vitamin Comparison
Vitamin comparison score is based on the number of vitamins by which one or the other food is richer. The "coverage" charts below show how much of the daily needs can be covered by 300 grams of the food.
5
100 g
300 g
3 oz - 85g 0.5 fillet - 159g
Vitamin C
Vit. C
Vitamin D
Vit. D
Vitamin A
Vit. A
Vitamin E
Vit. E
Vitamin B1
Vit. B1
Vitamin B2
Vit. B2
Vitamin B3
Vit. B3
Vitamin B5
Vit. B5
Vitamin B6
Vit. B6
Vitamin B12
Vit. B12
Vitamin K
Vit. K
Folate
Folate
0%
0%
6%
0%
18%
24%
36%
17%
112%
120%
0%
0.75%
5
100 g
300 g
1 oz - 28.35g 3 oz - 85g
Vitamin C
Vit. C
Vitamin D
Vit. D
Vitamin A
Vit. A
Vitamin E
Vit. E
Vitamin B1
Vit. B1
Vitamin B2
Vit. B2
Vitamin B3
Vit. B3
Vitamin B5
Vit. B5
Vitamin B6
Vit. B6
Vitamin B12
Vit. B12
Vitamin K
Vit. K
Folate
Folate
0%
0%
6.7%
13%
5%
4.8%
4.1%
4.2%
6.9%
200%
0.25%
1.5%
All nutrients comparison - raw data values
Nutrient
DV% diff.
Vitamin B6
0.485mg
0.03mg
35%
Selenium
46.8µg
28.1µg
34%
Vitamin B12
0.96µg
1.6µg
27%
Fats
17.74g
0.9g
26%
Monounsaturated fat
10.742g
0.149g
26%
Saturated fat
3.102g
0.191g
13%
Vitamin B3
1.923mg
0.22mg
11%
Cholesterol
59mg
30mg
10%
Phosphorus
210mg
282mg
10%
Polyunsaturated fat
1.753g
0.443g
9%
Calories
239kcal
99kcal
7%
Potassium
344mg
112mg
7%
Iron
0.85mg
0.26mg
7%
Protein
18.42g
15.18g
6%
Vitamin B2
0.103mg
0.021mg
6%
Vitamin E
0.63mg
4%
Vitamin B1
0.073mg
0.02mg
4%
Vitamin B5
0.288mg
0.07mg
4%
Carbs
0g
6.85g
2%
Magnesium
33mg
43mg
2%
Zinc
0.51mg
0.33mg
2%
Sodium
103mg
143mg
2%
Calcium
4mg
9mg
1%
Copper
0.038mg
0.032mg
1%
Protein per 100 calories
7.7g
15g
N/A
Calories per 10 g protein
130kcal
65kcal
N/A
Weight per 100 calories
42g
101g
N/A
Unsaturated / Saturated Fat ratio
4
3.1
N/A
Net carbs
0g
6.85g
N/A
Vitamin A
18µg
20µg
0%
Manganese
0.015mg
0.011mg
0%
Vitamin K
0.1µg
0%
Folate
1µg
2µg
0%
Tryptophan
0.206mg
0.092mg
0%
Threonine
0.808mg
0.734mg
0%
Isoleucine
0.849mg
0.709mg
0%
Leucine
1.497mg
1.202mg
0%
Lysine
1.692mg
1.387mg
0%
Methionine
0.545mg
0.515mg
0%
Phenylalanine
0.719mg
0.595mg
0%
Valine
0.949mg
0.77mg
0%
Histidine
0.542mg
0.35mg
0%
Omega-3 - EPA
0.674g
0.157g
N/A
Omega-3 - DHA
0.504g
0.241g
N/A
Omega-3 - DPA
0.114g
0.014g
N/A
Macronutrient Comparison
Macronutrient breakdown side-by-side comparison
3
18%
18%
62%
2%
Protein:
18.42 g
Fats:
17.74 g
Carbs:
0 g
Water:
61.88 g
Other:
1.96 g
2
15%
7%
76%
Protein:
15.18 g
Fats:
0.9 g
Carbs:
6.85 g
Water:
76.34 g
Other:
0.73 g
Contains
more
Protein Protein
+21.3%
Contains
more
Fats Fats
+1871.1%
Contains
more
Other Other
+168.5%
Contains
more
Carbs Carbs
+∞%
Contains
more
Water Water
+23.4%
Fat Type Comparison
Fat type breakdown side-by-side comparison
2
20%
69%
11%
Saturated fat:
Sat. Fat
3.102 g
Monounsaturated fat:
Mono. Fat
10.742 g
Polyunsaturated fat:
Poly. Fat
1.753 g
1
24%
19%
57%
Saturated fat:
Sat. Fat
0.191 g
Monounsaturated fat:
Mono. Fat
0.149 g
Polyunsaturated fat:
Poly. Fat
0.443 g
Contains
more
Mono. Fat Monounsaturated fat
+7109.4%
Contains
more
Poly. Fat Polyunsaturated fat
+295.7%
Contains
less
Sat. Fat Saturated fat
-93.8%