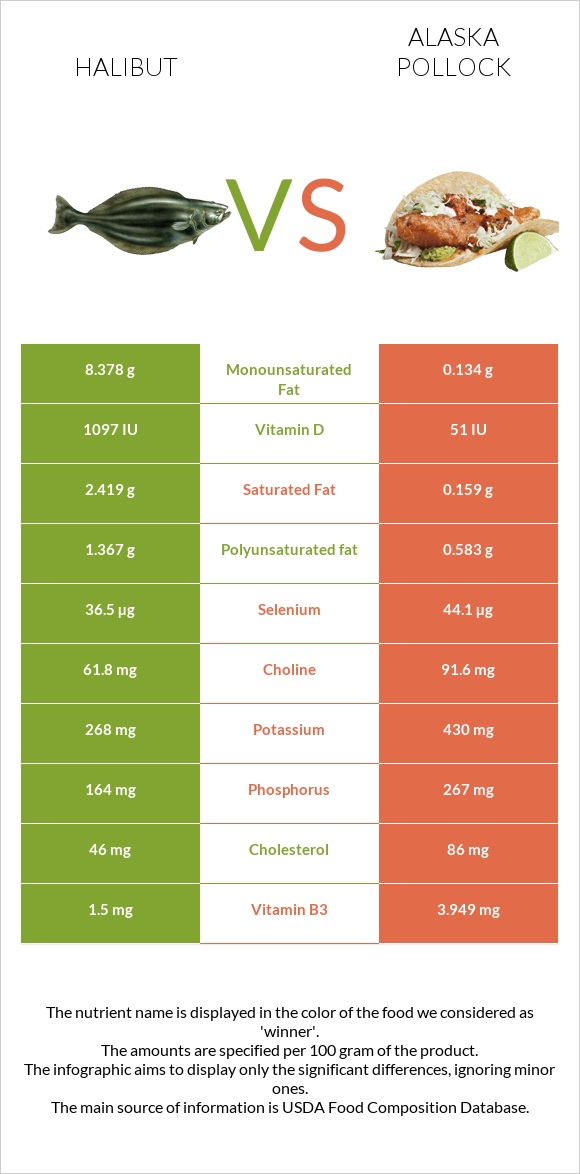
Summary of differences between halibut and pollock Halibut has more vitamin B6; however, pollock is higher in vitamin B12, vitamin B3, magnesium, vitamin B2, phosphorus, and calcium. Pollock covers your daily need for vitamin B12, 113% more than halibut. Halibut has 20 times more saturated fat than pollock. While halibut has 3.102g of saturated fat, pollock has only 0.159g. These are the specific foods used in this comparison Fish, halibut, greenland, cooked, dry heat and Fish, pollock, Alaska, cooked, dry heat (may have been previously frozen) .
Infographic
Mineral Comparison
Mineral comparison score is based on the number of minerals by which one or the other food is richer. The "coverage" charts below show how much of the daily needs can be covered by 300 grams of the food.
2
100 g
300 g
3 oz - 85g 0.5 fillet - 159g
Magnesium
Magnesium
Calcium
Calcium
Potassium
Potassium
Iron
Iron
Copper
Copper
Zinc
Zinc
Phosphorus
Phosphorus
Sodium
Sodium
Manganese
Manganese
Selenium
Selenium
24%
1.2%
30%
32%
13%
14%
90%
13%
2%
255%
7
100 g
300 g
1 fillet - 60g 3 oz - 85g
Magnesium
Magnesium
Calcium
Calcium
Potassium
Potassium
Iron
Iron
Copper
Copper
Zinc
Zinc
Phosphorus
Phosphorus
Sodium
Sodium
Manganese
Manganese
Selenium
Selenium
58%
22%
38%
21%
20%
16%
114%
55%
2.3%
241%
Vitamin Comparison
Vitamin comparison score is based on the number of vitamins by which one or the other food is richer. The "coverage" charts below show how much of the daily needs can be covered by 300 grams of the food.
2
100 g
300 g
3 oz - 85g 0.5 fillet - 159g
Vitamin C
Vit. C
Vitamin D
Vit. D
Vitamin A
Vit. A
Vitamin E
Vit. E
Vitamin B1
Vit. B1
Vitamin B2
Vit. B2
Vitamin B3
Vit. B3
Vitamin B5
Vit. B5
Vitamin B6
Vit. B6
Vitamin B12
Vit. B12
Vitamin K
Vit. K
Folate
Folate
0%
0%
6%
0%
18%
24%
36%
17%
112%
120%
0%
0.75%
8
100 g
300 g
1 fillet - 60g 3 oz - 85g
Vitamin C
Vit. C
Vitamin D
Vit. D
Vitamin A
Vit. A
Vitamin E
Vit. E
Vitamin B1
Vit. B1
Vitamin B2
Vit. B2
Vitamin B3
Vit. B3
Vitamin B5
Vit. B5
Vitamin B6
Vit. B6
Vitamin B12
Vit. B12
Vitamin K
Vit. K
Folate
Folate
0%
20%
5.7%
5.6%
14%
51%
74%
26%
76%
458%
0.25%
2.3%
All nutrients comparison - raw data values
Nutrient
DV% diff.
Vitamin B12
0.96µg
3.66µg
113%
Monounsaturated fat
10.742g
0.134g
27%
Fats
17.74g
1.18g
25%
Choline
91.6mg
17%
Sodium
103mg
419mg
14%
Vitamin B3
1.923mg
3.949mg
13%
Saturated fat
3.102g
0.159g
13%
Vitamin B6
0.485mg
0.329mg
12%
Magnesium
33mg
81mg
11%
Protein
18.42g
23.48g
10%
Cholesterol
59mg
86mg
9%
Vitamin B2
0.103mg
0.223mg
9%
Phosphorus
210mg
267mg
8%
Polyunsaturated fat
1.753g
0.583g
8%
Vitamin D
1.3µg
7%
Calcium
4mg
72mg
7%
Calories
239kcal
111kcal
6%
Vitamin D*
51 IU
6%
Selenium
46.8µg
44.1µg
5%
Iron
0.85mg
0.56mg
4%
Potassium
344mg
430mg
3%
Vitamin B5
0.288mg
0.432mg
3%
Copper
0.038mg
0.06mg
2%
Vitamin E
0.28mg
2%
Vitamin B1
0.073mg
0.054mg
2%
Zinc
0.51mg
0.57mg
1%
Folate
1µg
3µg
1%
Protein per 100 calories
7.7g
21g
N/A
Calories per 10 g protein
130kcal
47kcal
N/A
Weight per 100 calories
42g
90g
N/A
Unsaturated / Saturated Fat ratio
4
4.5
N/A
Vitamin A
18µg
17µg
0%
Manganese
0.015mg
0.018mg
0%
Vitamin K
0.1µg
0%
Tryptophan
0.206mg
0.263mg
0%
Threonine
0.808mg
1.029mg
0%
Isoleucine
0.849mg
1.082mg
0%
Leucine
1.497mg
1.908mg
0%
Lysine
1.692mg
2.157mg
0%
Methionine
0.545mg
0.696mg
0%
Phenylalanine
0.719mg
0.917mg
0%
Valine
0.949mg
1.21mg
0%
Histidine
0.542mg
0.691mg
0%
Omega-3 - EPA
0.674g
0.086g
N/A
Omega-3 - DHA
0.504g
0.423g
N/A
Omega-3 - DPA
0.114g
0.027g
N/A
Macronutrient Comparison
Macronutrient breakdown side-by-side comparison
2
18%
18%
62%
2%
Protein:
18.42 g
Fats:
17.74 g
Carbs:
0 g
Water:
61.88 g
Other:
1.96 g
2
23%
74%
2%
Protein:
23.48 g
Fats:
1.18 g
Carbs:
0 g
Water:
73.65 g
Other:
1.69 g
Contains
more
Fats Fats
+1403.4%
Contains
more
Other Other
+16%
Contains
more
Protein Protein
+27.5%
Contains
more
Water Water
+19%
Fat Type Comparison
Fat type breakdown side-by-side comparison
2
20%
69%
11%
Saturated fat:
Sat. Fat
3.102 g
Monounsaturated fat:
Mono. Fat
10.742 g
Polyunsaturated fat:
Poly. Fat
1.753 g
1
18%
15%
67%
Saturated fat:
Sat. Fat
0.159 g
Monounsaturated fat:
Mono. Fat
0.134 g
Polyunsaturated fat:
Poly. Fat
0.583 g
Contains
more
Mono. Fat Monounsaturated fat
+7916.4%
Contains
more
Poly. Fat Polyunsaturated fat
+200.7%
Contains
less
Sat. Fat Saturated fat
-94.9%