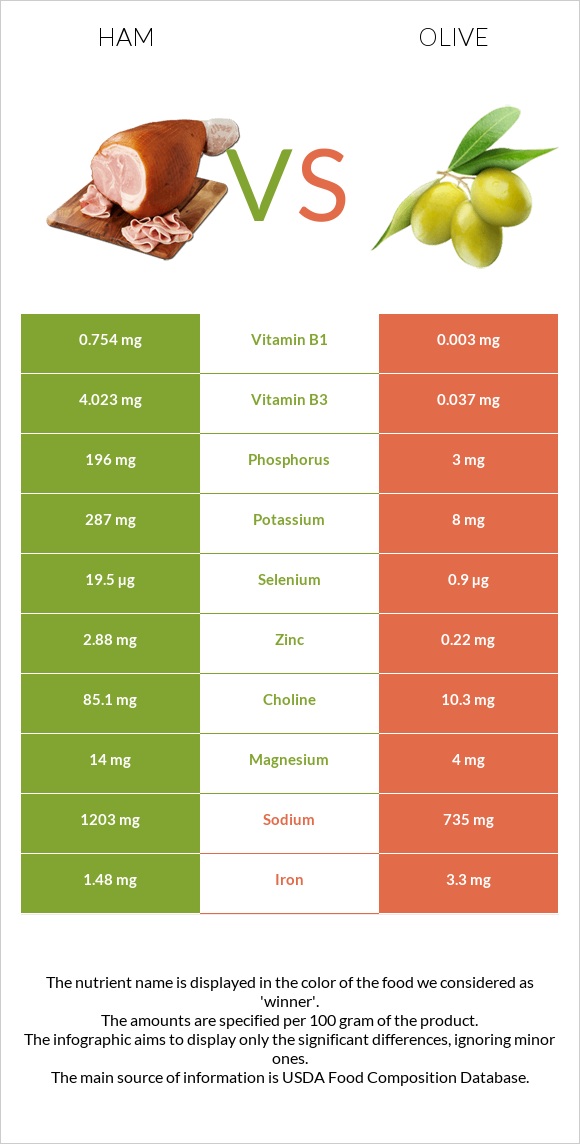
What are the differences between ham and olive? Ham is higher in vitamin B1, selenium, vitamin B6, phosphorus, vitamin B12, vitamin B3, and zinc, yet olive is higher in iron and copper. Ham's daily need coverage for vitamin B1 is 63% more. The amount of sodium in olive is lower. We used Pork, cured, ham, boneless, extra lean (approximately 5% fat), roasted and Olives, ripe, canned (small-extra large) types in this article.
Infographic
Mineral Comparison
Mineral comparison score is based on the number of minerals by which one or the other food is richer. The "coverage" charts below show how much of the daily needs can be covered by 300 grams of the food.
6
100 g
300 g
3 oz - 85g 1 cup - 140g
Magnesium
Magnesium
Calcium
Calcium
Potassium
Potassium
Iron
Iron
Copper
Copper
Zinc
Zinc
Phosphorus
Phosphorus
Sodium
Sodium
Manganese
Manganese
Selenium
Selenium
10%
2.4%
25%
56%
26%
79%
84%
157%
7%
106%
4
100 g
300 g
1 small - 3.2g 1 large - 4.4g 1 tbsp - 8.4g
Magnesium
Magnesium
Calcium
Calcium
Potassium
Potassium
Iron
Iron
Copper
Copper
Zinc
Zinc
Phosphorus
Phosphorus
Sodium
Sodium
Manganese
Manganese
Selenium
Selenium
2.9%
26%
0.71%
124%
84%
6%
1.3%
96%
2.6%
4.9%
Vitamin Comparison
Vitamin comparison score is based on the number of vitamins by which one or the other food is richer. The "coverage" charts below show how much of the daily needs can be covered by 300 grams of the food.
8
100 g
300 g
3 oz - 85g 1 cup - 140g
Vitamin C
Vit. C
Vitamin D
Vit. D
Vitamin A
Vit. A
Vitamin E
Vit. E
Vitamin B1
Vit. B1
Vitamin B2
Vit. B2
Vitamin B3
Vit. B3
Vitamin B5
Vit. B5
Vitamin B6
Vit. B6
Vitamin B12
Vit. B12
Vitamin K
Vit. K
Folate
Folate
0%
12%
0%
5%
189%
47%
75%
24%
92%
81%
0%
2.3%
4
100 g
300 g
1 small - 3.2g 1 large - 4.4g 1 tbsp - 8.4g
Vitamin C
Vit. C
Vitamin D
Vit. D
Vitamin A
Vit. A
Vitamin E
Vit. E
Vitamin B1
Vit. B1
Vitamin B2
Vit. B2
Vitamin B3
Vit. B3
Vitamin B5
Vit. B5
Vitamin B6
Vit. B6
Vitamin B12
Vit. B12
Vitamin K
Vit. K
Folate
Folate
3%
0%
6.7%
33%
0.75%
0%
0.69%
0.9%
2.1%
0%
3.5%
0%
All nutrients comparison - raw data values
Nutrient
DV% diff.
Vitamin B1
0.754mg
0.003mg
63%
Protein
20.93g
0.84g
40%
Selenium
19.5µg
0.9µg
34%
Vitamin B6
0.4mg
0.009mg
30%
Phosphorus
196mg
3mg
28%
Vitamin B12
0.65µg
0µg
27%
Vitamin B3
4.023mg
0.037mg
25%
Zinc
2.88mg
0.22mg
24%
Iron
1.48mg
3.3mg
23%
Sodium
1203mg
735mg
20%
Copper
0.079mg
0.251mg
19%
Cholesterol
53mg
0mg
18%
Vitamin B2
0.202mg
0mg
16%
Choline
85.1mg
10.3mg
14%
Fiber
0g
3.2g
13%
Monounsaturated fat
2.62g
7.888g
13%
Vitamin E
0.25mg
1.65mg
9%
Fats
5.53g
10.68g
8%
Calcium
8mg
88mg
8%
Potassium
287mg
8mg
8%
Vitamin B5
0.403mg
0.015mg
8%
Vitamin D*
32 IU
0 IU
4%
Vitamin D
0.8µg
0µg
4%
Calories
145kcal
115kcal
2%
Carbs
1.5g
6.26g
2%
Magnesium
14mg
4mg
2%
Vitamin A
0µg
20µg
2%
Saturated fat
1.81g
1.415g
2%
Polyunsaturated fat
0.54g
0.911g
2%
Vitamin C
0mg
0.9mg
1%
Manganese
0.054mg
0.02mg
1%
Vitamin K
0µg
1.4µg
1%
Folate
3µg
0µg
1%
Protein per 100 calories
14g
0.73g
N/A
Calories per 10 g protein
69kcal
1369kcal
N/A
Weight per 100 calories
69g
87g
N/A
Unsaturated / Saturated Fat ratio
1.7
6.2
N/A
Net carbs
1.5g
3.06g
N/A
Tryptophan
0.251mg
0%
Threonine
0.931mg
0.026mg
0%
Isoleucine
0.918mg
0.031mg
0%
Leucine
1.661mg
0.05mg
0%
Lysine
1.775mg
0.032mg
0%
Methionine
0.553mg
0.012mg
0%
Phenylalanine
0.904mg
0.029mg
0%
Valine
0.908mg
0.038mg
0%
Histidine
0.75mg
0.023mg
0%
Macronutrient Comparison
Macronutrient breakdown side-by-side comparison
2
21%
6%
68%
4%
Protein:
20.93 g
Fats:
5.53 g
Carbs:
1.5 g
Water:
67.67 g
Other:
4.37 g
3
11%
6%
80%
2%
Protein:
0.84 g
Fats:
10.68 g
Carbs:
6.26 g
Water:
79.99 g
Other:
2.23 g
Contains
more
Protein Protein
+2391.7%
Contains
more
Other Other
+96%
Contains
more
Fats Fats
+93.1%
Contains
more
Carbs Carbs
+317.3%
Contains
more
Water Water
+18.2%
Fat Type Comparison
Fat type breakdown side-by-side comparison
0
36%
53%
11%
Saturated fat:
Sat. Fat
1.81 g
Monounsaturated fat:
Mono. Fat
2.62 g
Polyunsaturated fat:
Poly. Fat
0.54 g
3
14%
77%
9%
Saturated fat:
Sat. Fat
1.415 g
Monounsaturated fat:
Mono. Fat
7.888 g
Polyunsaturated fat:
Poly. Fat
0.911 g
Contains
less
Sat. Fat Saturated fat
-21.8%
Contains
more
Mono. Fat Monounsaturated fat
+201.1%
Contains
more
Poly. Fat Polyunsaturated fat
+68.7%