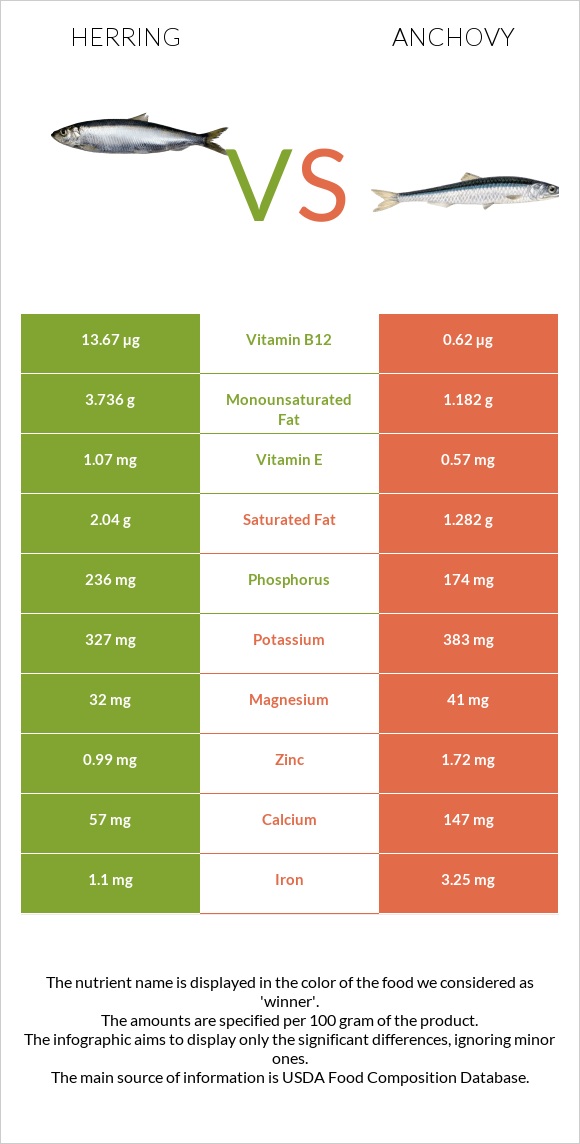
Differences between herring and anchovies Herring is higher in vitamin B12, selenium, phosphorus, and vitamin B6; however, anchovies are richer in vitamin B3, iron, copper, and calcium. Herring's daily need coverage for vitamin B12 is 522% higher. Herring has 2 times more vitamin B6 than anchovies. While herring has 0.348mg of vitamin B6, anchovies have only 0.143mg. Anchovies have less saturated fat. The food types used in this comparison are Fish, herring, Atlantic, cooked, dry heat and Fish, anchovy, european, raw .
Infographic
Mineral Comparison
Mineral comparison score is based on the number of minerals by which one or the other food is richer. The "coverage" charts below show how much of the daily needs can be covered by 300 grams of the food.
2
100 g
300 g
3 oz - 85g 1 fillet - 143g
Magnesium
Magnesium
Calcium
Calcium
Potassium
Potassium
Iron
Iron
Copper
Copper
Zinc
Zinc
Phosphorus
Phosphorus
Sodium
Sodium
Manganese
Manganese
Selenium
Selenium
29%
22%
37%
53%
39%
35%
130%
15%
5.2%
255%
5
100 g
300 g
3 oz - 85g
Magnesium
Magnesium
Calcium
Calcium
Potassium
Potassium
Iron
Iron
Copper
Copper
Zinc
Zinc
Phosphorus
Phosphorus
Sodium
Sodium
Manganese
Manganese
Selenium
Selenium
29%
44%
34%
122%
70%
47%
75%
14%
9.1%
199%
Vitamin Comparison
Vitamin comparison score is based on the number of vitamins by which one or the other food is richer. The "coverage" charts below show how much of the daily needs can be covered by 300 grams of the food.
10
100 g
300 g
3 oz - 85g 1 fillet - 143g
Vitamin C
Vit. C
Vitamin D
Vit. D
Vitamin A
Vit. A
Vitamin E
Vit. E
Vitamin B1
Vit. B1
Vitamin B2
Vit. B2
Vitamin B3
Vit. B3
Vitamin B5
Vit. B5
Vitamin B6
Vit. B6
Vitamin B12
Vit. B12
Vitamin K
Vit. K
Folate
Folate
2.3%
81%
12%
27%
28%
69%
77%
44%
80%
1643%
0.25%
9%
1
100 g
300 g
3 oz - 85g
Vitamin C
Vit. C
Vitamin D
Vit. D
Vitamin A
Vit. A
Vitamin E
Vit. E
Vitamin B1
Vit. B1
Vitamin B2
Vit. B2
Vitamin B3
Vit. B3
Vitamin B5
Vit. B5
Vitamin B6
Vit. B6
Vitamin B12
Vit. B12
Vitamin K
Vit. K
Folate
Folate
0%
0%
5%
11%
14%
59%
263%
39%
33%
78%
0.25%
6.8%
All nutrients comparison - raw data values
Nutrient
DV% diff.
Vitamin B12
13.14µg
0.62µg
522%
Vitamin B3
4.124mg
14.024mg
62%
Vitamin D*
214 IU
27%
Vitamin D
5.4µg
27%
Iron
1.41mg
3.25mg
23%
Selenium
46.8µg
36.5µg
19%
Phosphorus
303mg
174mg
18%
Vitamin B6
0.348mg
0.143mg
16%
Choline
83.3mg
15%
Fats
11.59g
4.84g
10%
Copper
0.118mg
0.211mg
10%
Monounsaturated fat
4.79g
1.182g
9%
Calcium
74mg
147mg
7%
Polyunsaturated fat
2.735g
1.637g
7%
Cholesterol
77mg
60mg
6%
Saturated fat
2.615g
1.282g
6%
Protein
23.03g
20.35g
5%
Vitamin E
1.37mg
0.57mg
5%
Vitamin B1
0.112mg
0.055mg
5%
Calories
203kcal
131kcal
4%
Zinc
1.27mg
1.72mg
4%
Vitamin B2
0.299mg
0.256mg
3%
Vitamin A
36µg
15µg
2%
Vitamin B5
0.74mg
0.645mg
2%
Vitamin C
0.7mg
0mg
1%
Potassium
419mg
383mg
1%
Manganese
0.04mg
0.07mg
1%
Folate
12µg
9µg
1%
Protein per 100 calories
11g
16g
N/A
Calories per 10 g protein
88kcal
64kcal
N/A
Weight per 100 calories
49g
76g
N/A
Unsaturated / Saturated Fat ratio
2.9
2.2
N/A
Magnesium
41mg
41mg
0%
Sodium
115mg
104mg
0%
Vitamin K
0.1µg
0.1µg
0%
Tryptophan
0.258mg
0.228mg
0%
Threonine
1.01mg
0.892mg
0%
Isoleucine
1.061mg
0.938mg
0%
Leucine
1.872mg
1.654mg
0%
Lysine
2.115mg
1.869mg
0%
Methionine
0.682mg
0.602mg
0%
Phenylalanine
0.899mg
0.794mg
0%
Valine
1.187mg
1.048mg
0%
Histidine
0.678mg
0.599mg
0%
Omega-3 - EPA
0.909g
0.538g
N/A
Omega-3 - DHA
1.105g
0.911g
N/A
Omega-3 - DPA
0.071g
0.029g
N/A
Macronutrient Comparison
Macronutrient breakdown side-by-side comparison
2
23%
12%
64%
Protein:
23.03 g
Fats:
11.59 g
Carbs:
0 g
Water:
64.16 g
Other:
1.22 g
2
20%
5%
73%
Protein:
20.35 g
Fats:
4.84 g
Carbs:
0 g
Water:
73.37 g
Other:
1.44 g
Contains
more
Protein Protein
+13.2%
Contains
more
Fats Fats
+139.5%
Contains
more
Water Water
+14.4%
Contains
more
Other Other
+18%
Fat Type Comparison
Fat type breakdown side-by-side comparison
2
26%
47%
27%
Saturated fat:
Sat. Fat
2.615 g
Monounsaturated fat:
Mono. Fat
4.79 g
Polyunsaturated fat:
Poly. Fat
2.735 g
1
31%
29%
40%
Saturated fat:
Sat. Fat
1.282 g
Monounsaturated fat:
Mono. Fat
1.182 g
Polyunsaturated fat:
Poly. Fat
1.637 g
Contains
more
Mono. Fat Monounsaturated fat
+305.2%
Contains
more
Poly. Fat Polyunsaturated fat
+67.1%
Contains
less
Sat. Fat Saturated fat
-51%