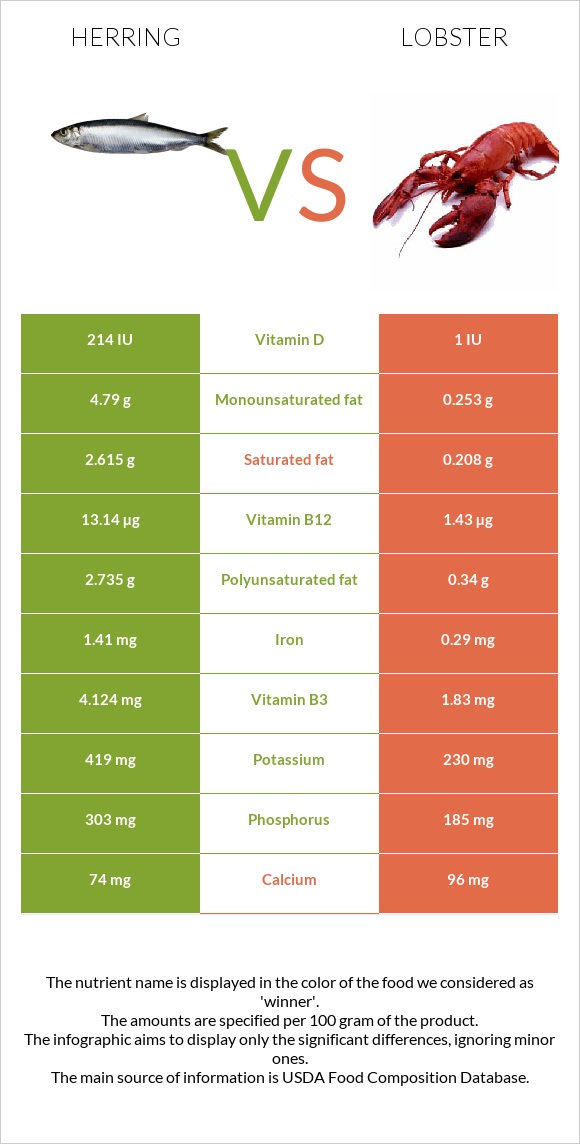
How are herring and lobster different? Herring is richer in vitamin B12, vitamin D*, vitamin B2, vitamin B6, and phosphorus, while lobster is higher in copper, selenium, zinc, and vitamin B5. Herring covers your daily need for vitamin B12, 488% more than lobster. Herring contains 214 times more vitamin D* than lobster. Herring contains 214 IU of vitamin D*, while lobster contains 1 IU. Herring is lower in cholesterol. Fish, herring, Atlantic, cooked, dry heat and Crustaceans, lobster, northern, cooked, moist heat types were used in this article.
Infographic
Mineral Comparison
Mineral comparison score is based on the number of minerals by which one or the other food is richer. The "coverage" charts below show how much of the daily needs can be covered by 300 grams of the food.
4
100 g
300 g
3 oz - 85g 1 fillet - 143g
Magnesium
Magnesium
Calcium
Calcium
Potassium
Potassium
Iron
Iron
Copper
Copper
Zinc
Zinc
Phosphorus
Phosphorus
Sodium
Sodium
Manganese
Manganese
Selenium
Selenium
29%
22%
37%
53%
39%
35%
130%
15%
5.2%
255%
5
100 g
300 g
3 oz - 85g 1 cup - 145g
Magnesium
Magnesium
Calcium
Calcium
Potassium
Potassium
Iron
Iron
Copper
Copper
Zinc
Zinc
Phosphorus
Phosphorus
Sodium
Sodium
Manganese
Manganese
Selenium
Selenium
31%
29%
20%
11%
517%
110%
79%
63%
8.5%
399%
Vitamin Comparison
Vitamin comparison score is based on the number of vitamins by which one or the other food is richer. The "coverage" charts below show how much of the daily needs can be covered by 300 grams of the food.
10
100 g
300 g
3 oz - 85g 1 fillet - 143g
Vitamin C
Vit. C
Vitamin D
Vit. D
Vitamin A
Vit. A
Vitamin E
Vit. E
Vitamin B1
Vit. B1
Vitamin B2
Vit. B2
Vitamin B3
Vit. B3
Vitamin B5
Vit. B5
Vitamin B6
Vit. B6
Vitamin B12
Vit. B12
Vitamin K
Vit. K
Folate
Folate
2.3%
81%
12%
27%
28%
69%
77%
44%
80%
1643%
0.25%
9%
1
100 g
300 g
3 oz - 85g 1 cup - 145g
Vitamin C
Vit. C
Vitamin D
Vit. D
Vitamin A
Vit. A
Vitamin E
Vit. E
Vitamin B1
Vit. B1
Vitamin B2
Vit. B2
Vitamin B3
Vit. B3
Vitamin B5
Vit. B5
Vitamin B6
Vit. B6
Vitamin B12
Vit. B12
Vitamin K
Vit. K
Folate
Folate
0%
0%
0.33%
20%
5.8%
3.9%
34%
100%
27%
179%
0%
8.3%
All nutrients comparison - raw data values
Nutrient
DV% diff.
Vitamin B12
13.14µg
1.43µg
488%
Copper
0.118mg
1.55mg
159%
Selenium
46.8µg
73.1µg
48%
Vitamin D*
214 IU
1 IU
27%
Vitamin D
5.4µg
0µg
27%
Zinc
1.27mg
4.05mg
25%
Cholesterol
77mg
146mg
23%
Vitamin B2
0.299mg
0.017mg
22%
Vitamin B5
0.74mg
1.667mg
19%
Vitamin B6
0.348mg
0.119mg
18%
Fats
11.59g
0.86g
17%
Phosphorus
303mg
185mg
17%
Sodium
115mg
486mg
16%
Polyunsaturated fat
2.735g
0.34g
16%
Iron
1.41mg
0.29mg
14%
Vitamin B3
4.124mg
1.83mg
14%
Saturated fat
2.615g
0.208g
11%
Monounsaturated fat
4.79g
0.253g
11%
Protein
23.03g
19g
8%
Vitamin B1
0.112mg
0.023mg
7%
Calories
203kcal
89kcal
6%
Potassium
419mg
230mg
6%
Vitamin A
36µg
1µg
4%
Calcium
74mg
96mg
2%
Vitamin E
1.37mg
1mg
2%
Vitamin C
0.7mg
0mg
1%
Manganese
0.04mg
0.065mg
1%
Protein per 100 calories
11g
21g
N/A
Calories per 10 g protein
88kcal
47kcal
N/A
Weight per 100 calories
49g
112g
N/A
Unsaturated / Saturated Fat ratio
2.9
2.9
N/A
Magnesium
41mg
43mg
0%
Vitamin K
0.1µg
0µg
0%
Folate
12µg
11µg
0%
Trans fat
0.013g
N/A
Choline
83.3mg
80.9mg
0%
Tryptophan
0.258mg
0.248mg
0%
Threonine
1.01mg
0.753mg
0%
Isoleucine
1.061mg
0.832mg
0%
Leucine
1.872mg
1.376mg
0%
Lysine
2.115mg
1.426mg
0%
Methionine
0.682mg
0.475mg
0%
Phenylalanine
0.899mg
0.782mg
0%
Valine
1.187mg
0.852mg
0%
Histidine
0.678mg
0.475mg
0%
Omega-3 - EPA
0.909g
0.117g
N/A
Omega-3 - DHA
1.105g
0.078g
N/A
Omega-3 - ALA
0.05g
N/A
Omega-3 - DPA
0.071g
0.006g
N/A
Omega-3 - Eicosatrienoic acid
0.006g
N/A
Omega-6 - Dihomo-gamma-linoleic acid
0.006g
N/A
Omega-6 - Eicosadienoic acid
0.006g
N/A
Omega-6 - Linoleic acid
0.033g
N/A
Macronutrient Comparison
Macronutrient breakdown side-by-side comparison
2
23%
12%
64%
Protein:
23.03 g
Fats:
11.59 g
Carbs:
0 g
Water:
64.16 g
Other:
1.22 g
2
19%
78%
2%
Protein:
19 g
Fats:
0.86 g
Carbs:
0 g
Water:
78.11 g
Other:
2.03 g
Contains
more
Protein Protein
+21.2%
Contains
more
Fats Fats
+1247.7%
Contains
more
Water Water
+21.7%
Contains
more
Other Other
+66.4%
Fat Type Comparison
Fat type breakdown side-by-side comparison
2
26%
47%
27%
Saturated fat:
Sat. Fat
2.615 g
Monounsaturated fat:
Mono. Fat
4.79 g
Polyunsaturated fat:
Poly. Fat
2.735 g
1
26%
32%
42%
Saturated fat:
Sat. Fat
0.208 g
Monounsaturated fat:
Mono. Fat
0.253 g
Polyunsaturated fat:
Poly. Fat
0.34 g
Contains
more
Mono. Fat Monounsaturated fat
+1793.3%
Contains
more
Poly. Fat Polyunsaturated fat
+704.4%
Contains
less
Sat. Fat Saturated fat
-92%