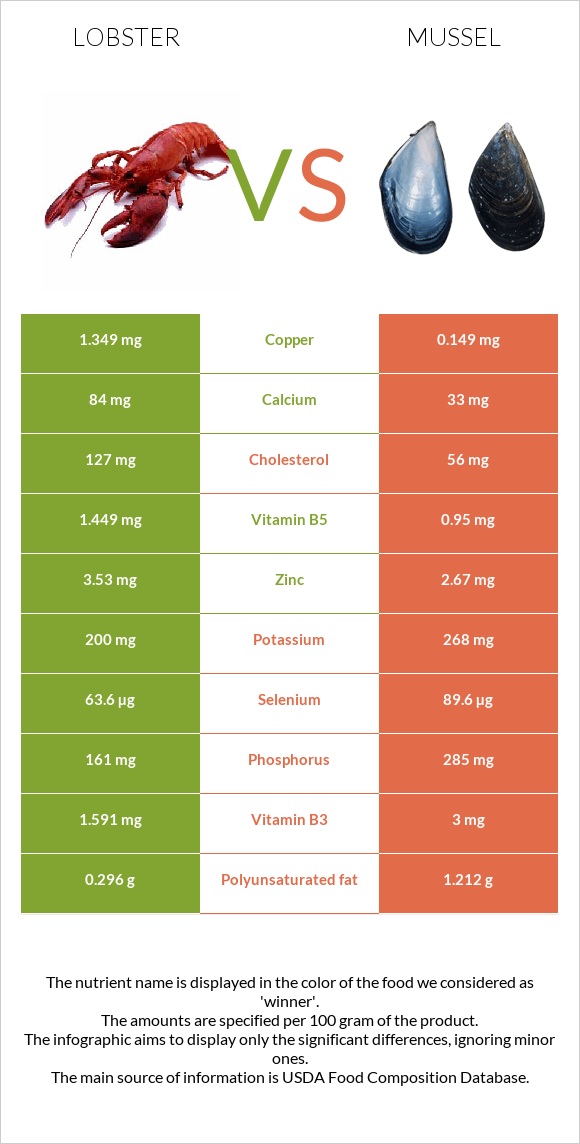
Summary of differences between lobster and mussels Lobster has more copper; however, mussels is higher in vitamin B12, manganese, iron, vitamin B2, selenium, vitamin B1, folate, and vitamin C. Mussels covers your daily need for vitamin B12, 940% more than lobster. Lobster has 10 times more copper than mussels. While lobster has 1.55mg of copper, mussels has only 0.149mg. Mussels has less cholesterol. The glycemic index of mussels is higher. These are the specific foods used in this comparison Crustaceans, lobster, northern, cooked, moist heat and Mollusks, mussel, blue, cooked, moist heat .
Infographic
Mineral Comparison
Mineral comparison score is based on the number of minerals by which one or the other food is richer. The "coverage" charts below show how much of the daily needs can be covered by 300 grams of the food.
4
100 g
300 g
3 oz - 85g 1 cup - 145g
Magnesium
Magnesium
Calcium
Calcium
Potassium
Potassium
Iron
Iron
Copper
Copper
Zinc
Zinc
Phosphorus
Phosphorus
Sodium
Sodium
Manganese
Manganese
Selenium
Selenium
31%
29%
20%
11%
517%
110%
79%
63%
8.5%
399%
6
100 g
300 g
3 oz - 85g
Magnesium
Magnesium
Calcium
Calcium
Potassium
Potassium
Iron
Iron
Copper
Copper
Zinc
Zinc
Phosphorus
Phosphorus
Sodium
Sodium
Manganese
Manganese
Selenium
Selenium
26%
9.9%
24%
252%
50%
73%
122%
48%
887%
489%
Vitamin Comparison
Vitamin comparison score is based on the number of vitamins by which one or the other food is richer. The "coverage" charts below show how much of the daily needs can be covered by 300 grams of the food.
3
100 g
300 g
3 oz - 85g 1 cup - 145g
Vitamin C
Vit. C
Vitamin D
Vit. D
Vitamin A
Vit. A
Vitamin E
Vit. E
Vitamin B1
Vit. B1
Vitamin B2
Vit. B2
Vitamin B3
Vit. B3
Vitamin B5
Vit. B5
Vitamin B6
Vit. B6
Vitamin B12
Vit. B12
Vitamin K
Vit. K
Folate
Folate
0%
0%
0.33%
20%
5.8%
3.9%
34%
100%
27%
179%
0%
8.3%
7
100 g
300 g
3 oz - 85g
Vitamin C
Vit. C
Vitamin D
Vit. D
Vitamin A
Vit. A
Vitamin E
Vit. E
Vitamin B1
Vit. B1
Vitamin B2
Vit. B2
Vitamin B3
Vit. B3
Vitamin B5
Vit. B5
Vitamin B6
Vit. B6
Vitamin B12
Vit. B12
Vitamin K
Vit. K
Folate
Folate
45%
0%
30%
0%
75%
97%
56%
57%
23%
3000%
0%
57%
All nutrients comparison - raw data values
Nutrient
DV% diff.
Vitamin B12
1.43µg
24µg
940%
Manganese
0.065mg
6.8mg
293%
Copper
1.55mg
0.149mg
156%
Iron
0.29mg
6.72mg
80%
Vitamin B2
0.017mg
0.42mg
31%
Cholesterol
146mg
56mg
30%
Selenium
73.1µg
89.6µg
30%
Vitamin B1
0.023mg
0.3mg
23%
Folate
11µg
76µg
16%
Vitamin C
0mg
13.6mg
15%
Choline
80.9mg
15%
Phosphorus
185mg
285mg
14%
Vitamin B5
1.667mg
0.95mg
14%
Zinc
4.05mg
2.67mg
13%
Protein
19g
23.8g
10%
Vitamin A
1µg
91µg
10%
Vitamin E
1mg
7%
Vitamin B3
1.83mg
3mg
7%
Fats
0.86g
4.48g
6%
Calcium
96mg
33mg
6%
Polyunsaturated fat
0.34g
1.212g
6%
Sodium
486mg
369mg
5%
Calories
89kcal
172kcal
4%
Saturated fat
0.208g
0.85g
3%
Carbs
0g
7.39g
2%
Monounsaturated fat
0.253g
1.014g
2%
Magnesium
43mg
37mg
1%
Potassium
230mg
268mg
1%
Vitamin B6
0.119mg
0.1mg
1%
Protein per 100 calories
21g
14g
N/A
Calories per 10 g protein
47kcal
72kcal
N/A
Weight per 100 calories
112g
58g
N/A
Unsaturated / Saturated Fat ratio
2.9
2.6
N/A
Net carbs
0g
7.39g
N/A
Vitamin D*
1 IU
0%
Trans fat
0.013g
N/A
Tryptophan
0.248mg
0.267mg
0%
Threonine
0.753mg
1.025mg
0%
Isoleucine
0.832mg
1.036mg
0%
Leucine
1.376mg
1.676mg
0%
Lysine
1.426mg
1.779mg
0%
Methionine
0.475mg
0.537mg
0%
Phenylalanine
0.782mg
0.853mg
0%
Valine
0.852mg
1.04mg
0%
Histidine
0.475mg
0.457mg
0%
Omega-3 - EPA
0.117g
0.276g
N/A
Omega-3 - DHA
0.078g
0.506g
N/A
Omega-3 - ALA
0.05g
N/A
Omega-3 - DPA
0.006g
0.044g
N/A
Omega-3 - Eicosatrienoic acid
0.006g
N/A
Omega-6 - Dihomo-gamma-linoleic acid
0.006g
N/A
Omega-6 - Eicosadienoic acid
0.006g
N/A
Omega-6 - Linoleic acid
0.033g
N/A
Macronutrient Comparison
Macronutrient breakdown side-by-side comparison
1
19%
78%
2%
Protein:
19 g
Fats:
0.86 g
Carbs:
0 g
Water:
78.11 g
Other:
2.03 g
4
24%
4%
7%
61%
3%
Protein:
23.8 g
Fats:
4.48 g
Carbs:
7.39 g
Water:
61.15 g
Other:
3.18 g
Contains
more
Water Water
+27.7%
Contains
more
Protein Protein
+25.3%
Contains
more
Fats Fats
+420.9%
Contains
more
Carbs Carbs
+∞%
Contains
more
Other Other
+56.7%
Fat Type Comparison
Fat type breakdown side-by-side comparison
1
26%
32%
42%
Saturated fat:
Sat. Fat
0.208 g
Monounsaturated fat:
Mono. Fat
0.253 g
Polyunsaturated fat:
Poly. Fat
0.34 g
2
28%
33%
39%
Saturated fat:
Sat. Fat
0.85 g
Monounsaturated fat:
Mono. Fat
1.014 g
Polyunsaturated fat:
Poly. Fat
1.212 g
Contains
less
Sat. Fat Saturated fat
-75.5%
Contains
more
Mono. Fat Monounsaturated fat
+300.8%
Contains
more
Poly. Fat Polyunsaturated fat
+256.5%