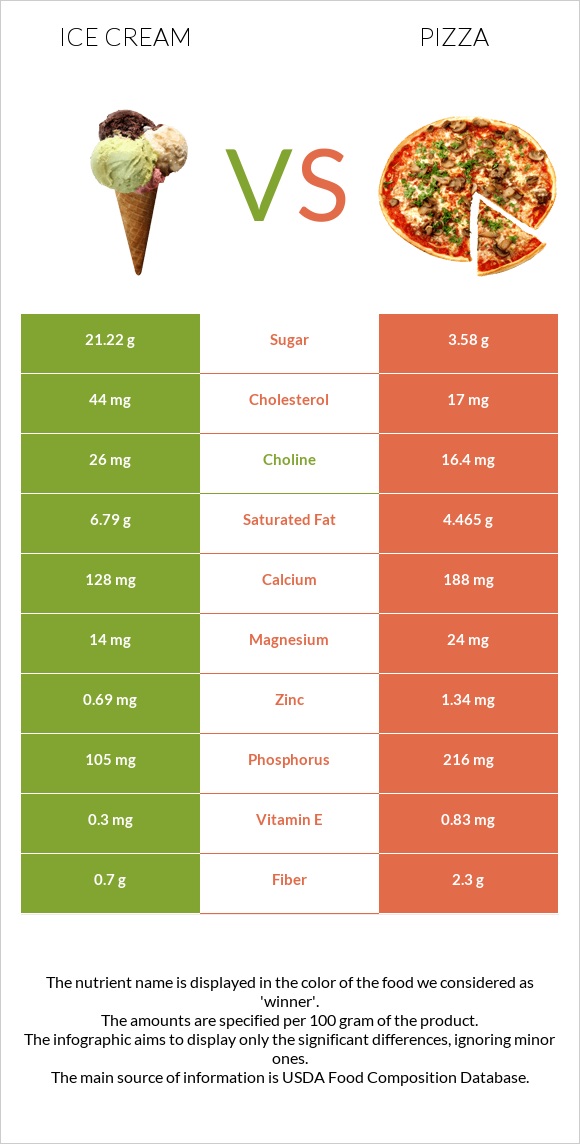
The main differences between ice cream and pizza Pizza is richer than ice cream in selenium, iron, vitamin B1, vitamin B3, folate, phosphorus, manganese, and copper. Daily need coverage for selenium for pizza is 33% higher. Ice cream contains 2 times more saturated fat than pizza. Ice cream contains 6.79g of saturated fat, while pizza contains 4.465g. Food types used in this article are Ice creams, vanilla and Fast Food, Pizza Chain, 14" pizza, cheese topping, regular crust .
Infographic
Mineral Comparison
Mineral comparison score is based on the number of minerals by which one or the other food is richer. The "coverage" charts below show how much of the daily needs can be covered by 300 grams of the food.
2
100 g
300 g
1 serving 1/2 cup - 66g
Magnesium
Magnesium
Calcium
Calcium
Potassium
Potassium
Iron
Iron
Copper
Copper
Zinc
Zinc
Phosphorus
Phosphorus
Sodium
Sodium
Manganese
Manganese
Selenium
Selenium
10%
38%
18%
3.4%
7.7%
19%
45%
10%
1%
9.8%
8
100 g
300 g
1 slice - 107g 1 pizza - 853g
Magnesium
Magnesium
Calcium
Calcium
Potassium
Potassium
Iron
Iron
Copper
Copper
Zinc
Zinc
Phosphorus
Phosphorus
Sodium
Sodium
Manganese
Manganese
Selenium
Selenium
17%
56%
15%
93%
35%
37%
93%
78%
47%
109%
Vitamin Comparison
Vitamin comparison score is based on the number of vitamins by which one or the other food is richer. The "coverage" charts below show how much of the daily needs can be covered by 300 grams of the food.
4
100 g
300 g
1 serving 1/2 cup - 66g
Vitamin C
Vit. C
Vitamin D
Vit. D
Vitamin A
Vit. A
Vitamin E
Vit. E
Vitamin B1
Vit. B1
Vitamin B2
Vit. B2
Vitamin B3
Vit. B3
Vitamin B5
Vit. B5
Vitamin B6
Vit. B6
Vitamin B12
Vit. B12
Vitamin K
Vit. K
Folate
Folate
2%
3%
39%
6%
10%
55%
2.2%
35%
11%
49%
0.75%
3.8%
7
100 g
300 g
1 slice - 107g 1 pizza - 853g
Vitamin C
Vit. C
Vitamin D
Vit. D
Vitamin A
Vit. A
Vitamin E
Vit. E
Vitamin B1
Vit. B1
Vitamin B2
Vit. B2
Vitamin B3
Vit. B3
Vitamin B5
Vit. B5
Vitamin B6
Vit. B6
Vitamin B12
Vit. B12
Vitamin K
Vit. K
Folate
Folate
4.7%
0%
23%
17%
98%
45%
72%
0%
18%
53%
17%
70%
All nutrients comparison - raw data values
Nutrient
DV% diff.
Selenium
1.8µg
19.9µg
33%
Iron
0.09mg
2.48mg
30%
Vitamin B1
0.041mg
0.39mg
29%
Sodium
80mg
598mg
23%
Vitamin B3
0.116mg
3.825mg
23%
Folate
5µg
93µg
22%
Protein
3.5g
11.39g
16%
Phosphorus
105mg
216mg
16%
Manganese
0.008mg
0.36mg
15%
Vitamin B5
0.581mg
12%
Starch
26.95g
11%
Saturated fat
6.79g
4.465g
11%
Cholesterol
44mg
17mg
9%
Copper
0.023mg
0.105mg
9%
Polyunsaturated fat
0.452g
1.681g
8%
Calcium
128mg
188mg
6%
Fiber
0.7g
2.3g
6%
Zinc
0.69mg
1.34mg
6%
Vitamin A
118µg
69µg
5%
Vitamin K
0.3µg
6.7µg
5%
Vitamin E
0.3mg
0.83mg
4%
Calories
207kcal
266kcal
3%
Carbs
23.6g
33.33g
3%
Vitamin B2
0.24mg
0.195mg
3%
Fats
11g
9.69g
2%
Magnesium
14mg
24mg
2%
Vitamin B6
0.048mg
0.08mg
2%
Choline
26mg
16.4mg
2%
Vitamin C
0.6mg
1.4mg
1%
Vitamin D*
8 IU
0 IU
1%
Vitamin D
0.2µg
0µg
1%
Potassium
199mg
172mg
1%
Vitamin B12
0.39µg
0.42µg
1%
Monounsaturated fat
2.969g
2.608g
1%
Fructose
1g
1%
Protein per 100 calories
1.7g
4.3g
N/A
Calories per 10 g protein
591kcal
234kcal
N/A
Weight per 100 calories
48g
38g
N/A
Unsaturated / Saturated Fat ratio
0.5
0.96
N/A
Net carbs
22.9g
31.03g
N/A
Sugar
21.22g
3.58g
N/A
Trans fat
0.241g
N/A
Tryptophan
0.045mg
0%
Threonine
0.146mg
0.41mg
0%
Isoleucine
0.195mg
0.564mg
0%
Leucine
0.316mg
1.139mg
0%
Lysine
0.258mg
0.77mg
0%
Methionine
0.081mg
0.264mg
0%
Phenylalanine
0.157mg
0.664mg
0%
Valine
0.217mg
0.72mg
0%
Histidine
0.088mg
0.355mg
0%
Omega-3 - EPA
0.003g
0.004g
N/A
Omega-3 - ALA
0.175g
N/A
Omega-3 - DPA
0g
0.004g
N/A
Omega-6 - Gamma-linoleic acid
0.003g
N/A
Omega-6 - Dihomo-gamma-linoleic acid
0.009g
N/A
Omega-6 - Eicosadienoic acid
0.003g
N/A
Omega-6 - Linoleic acid
1.367g
N/A
Macronutrient Comparison
Macronutrient breakdown side-by-side comparison
2
4%
11%
24%
61%
Protein:
3.5 g
Fats:
11 g
Carbs:
23.6 g
Water:
61 g
Other:
0.9 g
3
11%
10%
33%
43%
2%
Protein:
11.39 g
Fats:
9.69 g
Carbs:
33.33 g
Water:
43.17 g
Other:
2.42 g
Contains
more
Fats Fats
+13.5%
Contains
more
Water Water
+41.3%
Contains
more
Protein Protein
+225.4%
Contains
more
Carbs Carbs
+41.2%
Contains
more
Other Other
+168.9%
Fat Type Comparison
Fat type breakdown side-by-side comparison
1
66%
29%
4%
Saturated fat:
Sat. Fat
6.79 g
Monounsaturated fat:
Mono. Fat
2.969 g
Polyunsaturated fat:
Poly. Fat
0.452 g
2
51%
30%
19%
Saturated fat:
Sat. Fat
4.465 g
Monounsaturated fat:
Mono. Fat
2.608 g
Polyunsaturated fat:
Poly. Fat
1.681 g
Contains
more
Mono. Fat Monounsaturated fat
+13.8%
Contains
less
Sat. Fat Saturated fat
-34.2%
Contains
more
Poly. Fat Polyunsaturated fat
+271.9%