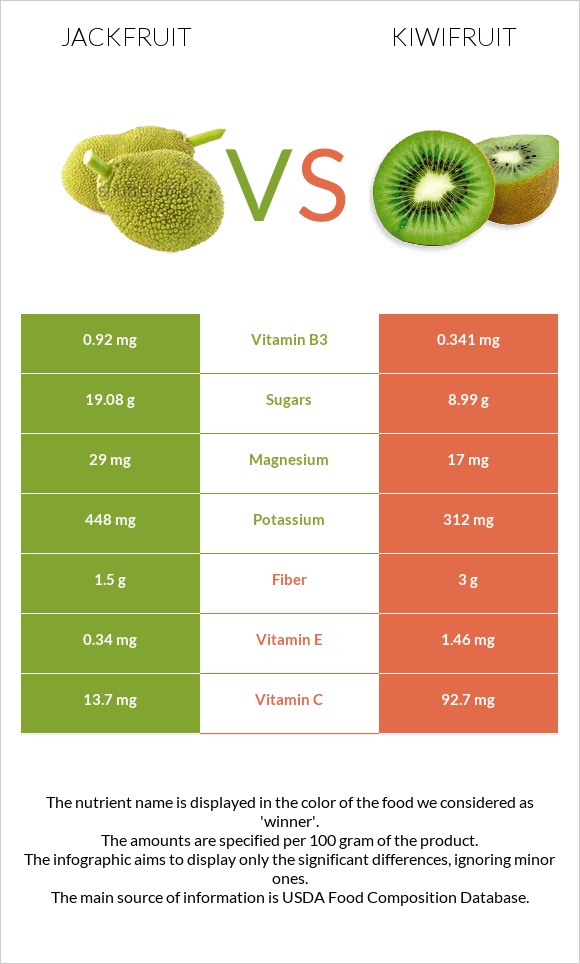
Important differences between jackfruit and kiwi Jackfruit has more vitamin B6 and vitamin B1; however, kiwi has more vitamin C, vitamin E, fiber, and copper. Kiwi's daily need coverage for vitamin C is 88% more. Jackfruit has 5 times more vitamin B6 than kiwi. Jackfruit has 0.329mg of vitamin B6, while kiwi has 0.063mg. Kiwi is lower in sugar. Jackfruit has a higher glycemic index than kiwi. The food varieties used in the comparison are Jackfruit, raw and Kiwifruit, green, raw .
Infographic
Mineral Comparison
Mineral comparison score is based on the number of minerals by which one or the other food is richer. The "coverage" charts below show how much of the daily needs can be covered by 300 grams of the food.
3
100 g
300 g
1 cup 1" pieces - 151g 1 cup, sliced - 165g
Magnesium
Magnesium
Calcium
Calcium
Potassium
Potassium
Iron
Iron
Copper
Copper
Zinc
Zinc
Phosphorus
Phosphorus
Sodium
Sodium
Manganese
Manganese
Selenium
Selenium
21%
7.2%
40%
8.6%
25%
3.5%
9%
0.26%
5.6%
0%
6
100 g
300 g
1 fruit (2" dia) - 69g 1 NLEA serving - 148g 1 cup, sliced - 180g
Magnesium
Magnesium
Calcium
Calcium
Potassium
Potassium
Iron
Iron
Copper
Copper
Zinc
Zinc
Phosphorus
Phosphorus
Sodium
Sodium
Manganese
Manganese
Selenium
Selenium
12%
10%
28%
12%
43%
3.8%
15%
0.39%
13%
1.1%
Vitamin Comparison
Vitamin comparison score is based on the number of vitamins by which one or the other food is richer. The "coverage" charts below show how much of the daily needs can be covered by 300 grams of the food.
6
100 g
300 g
1 cup 1" pieces - 151g 1 cup, sliced - 165g
Vitamin C
Vit. C
Vitamin D
Vit. D
Vitamin A
Vit. A
Vitamin E
Vit. E
Vitamin B1
Vit. B1
Vitamin B2
Vit. B2
Vitamin B3
Vit. B3
Vitamin B5
Vit. B5
Vitamin B6
Vit. B6
Vitamin B12
Vit. B12
Vitamin K
Vit. K
Folate
Folate
46%
0%
1.7%
6.8%
26%
13%
17%
14%
76%
0%
0%
18%
3
100 g
300 g
1 fruit (2" dia) - 69g 1 NLEA serving - 148g 1 cup, sliced - 180g
Vitamin C
Vit. C
Vitamin D
Vit. D
Vitamin A
Vit. A
Vitamin E
Vit. E
Vitamin B1
Vit. B1
Vitamin B2
Vit. B2
Vitamin B3
Vit. B3
Vitamin B5
Vit. B5
Vitamin B6
Vit. B6
Vitamin B12
Vit. B12
Vitamin K
Vit. K
Folate
Folate
309%
0%
1.3%
29%
6.8%
5.8%
6.4%
11%
15%
0%
101%
19%
All nutrients comparison - raw data values
Nutrient
DV% diff.
Vitamin C
13.7mg
92.7mg
88%
Vitamin K
40.3µg
34%
Vitamin B6
0.329mg
0.063mg
20%
Vitamin E
0.34mg
1.46mg
7%
Vitamin B1
0.105mg
0.027mg
7%
Fiber
1.5g
3g
6%
Copper
0.076mg
0.13mg
6%
Fructose
9.19g
4.35g
6%
Potassium
448mg
312mg
4%
Vitamin B3
0.92mg
0.341mg
4%
Carbs
23.25g
14.66g
3%
Magnesium
29mg
17mg
3%
Calories
95kcal
61kcal
2%
Phosphorus
21mg
34mg
2%
Manganese
0.043mg
0.098mg
2%
Vitamin B2
0.055mg
0.025mg
2%
Protein
1.72g
1.14g
1%
Calcium
24mg
34mg
1%
Iron
0.23mg
0.31mg
1%
Starch
1.47g
0g
1%
Vitamin B5
0.235mg
0.183mg
1%
Choline
7.8mg
1%
Saturated fat
0.195g
0.029g
1%
Polyunsaturated fat
0.094g
0.287g
1%
Protein per 100 calories
1.8g
1.9g
N/A
Calories per 10 g protein
552kcal
535kcal
N/A
Weight per 100 calories
105g
164g
N/A
Fats
0.64g
0.52g
0%
Net carbs
21.75g
11.66g
N/A
Sugar
19.08g
8.99g
N/A
Zinc
0.13mg
0.14mg
0%
Sodium
2mg
3mg
0%
Vitamin A
5µg
4µg
0%
Selenium
0.2µg
0%
Folate
24µg
25µg
0%
Monounsaturated fat
0.155g
0.047g
0%
Tryptophan
0.034mg
0.015mg
0%
Threonine
0.086mg
0.047mg
0%
Isoleucine
0.069mg
0.051mg
0%
Leucine
0.103mg
0.066mg
0%
Lysine
0.069mg
0.061mg
0%
Methionine
0.034mg
0.024mg
0%
Phenylalanine
0.052mg
0.044mg
0%
Valine
0.086mg
0.057mg
0%
Histidine
0.034mg
0.027mg
0%
Omega-3 - ALA
0.079g
N/A
Omega-6 - Linoleic acid
0.015g
N/A
Macronutrient Comparison
Macronutrient breakdown side-by-side comparison
4
2%
23%
73%
Protein:
1.72 g
Fats:
0.64 g
Carbs:
23.25 g
Water:
73.46 g
Other:
0.93 g
1
15%
83%
Protein:
1.14 g
Fats:
0.52 g
Carbs:
14.66 g
Water:
83.07 g
Other:
0.61 g
Contains
more
Protein Protein
+50.9%
Contains
more
Fats Fats
+23.1%
Contains
more
Carbs Carbs
+58.6%
Contains
more
Other Other
+52.5%
Contains
more
Water Water
+13.1%
Fat Type Comparison
Fat type breakdown side-by-side comparison
1
44%
35%
21%
Saturated fat:
Sat. Fat
0.195 g
Monounsaturated fat:
Mono. Fat
0.155 g
Polyunsaturated fat:
Poly. Fat
0.094 g
2
8%
13%
79%
Saturated fat:
Sat. Fat
0.029 g
Monounsaturated fat:
Mono. Fat
0.047 g
Polyunsaturated fat:
Poly. Fat
0.287 g
Contains
more
Mono. Fat Monounsaturated fat
+229.8%
Contains
less
Sat. Fat Saturated fat
-85.1%
Contains
more
Poly. Fat Polyunsaturated fat
+205.3%
Carbohydrate type comparison
Carbohydrate type breakdown side-by-side comparison
4
7%
2%
46%
45%
Starch:
1.47 g
Sucrose:
0.42 g
Glucose:
9.48 g
Fructose:
9.19 g
Lactose:
0 g
Maltose:
0 g
Galactose:
0 g
2
2%
46%
48%
2%
2%
Starch:
0 g
Sucrose:
0.15 g
Glucose:
4.11 g
Fructose:
4.35 g
Lactose:
0 g
Maltose:
0.19 g
Galactose:
0.17 g
Contains
more
Starch Starch
+∞%
Contains
more
Sucrose Sucrose
+180%
Contains
more
Glucose Glucose
+130.7%
Contains
more
Fructose Fructose
+111.3%
Contains
more
Maltose Maltose
+∞%
Contains
more
Galactose Galactose
+∞%