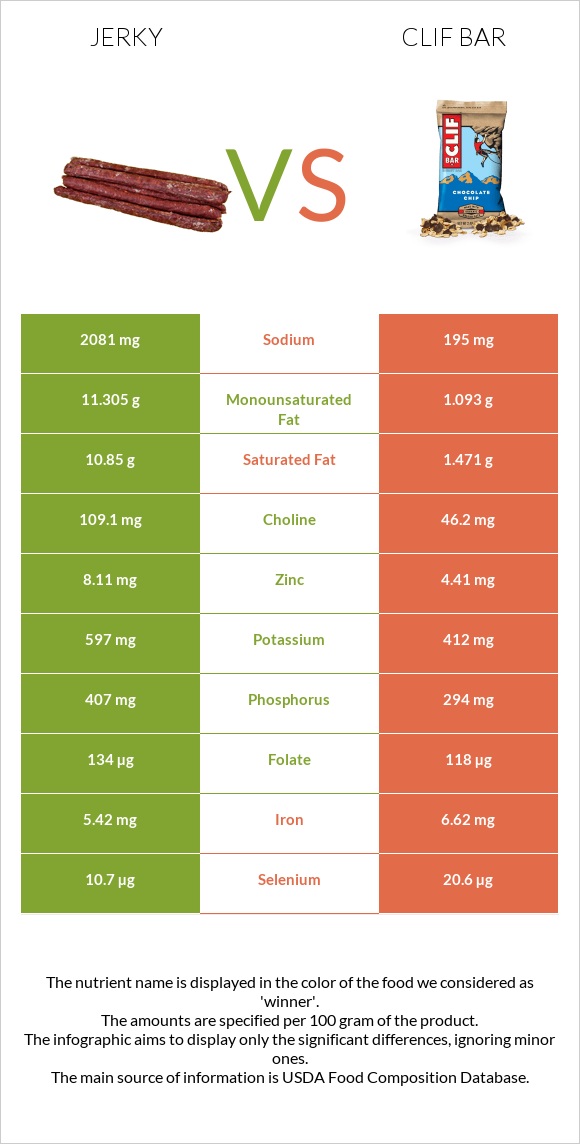
Summary of differences between jerky and clif Bar Jerky has more zinc, while clif Bar has more vitamin C, manganese, vitamin B5, calcium, vitamin B1, vitamin B6, and vitamin K. Clif Bar covers your daily need for vitamin C, 98% more than jerky. Jerky contains 11 times more sodium than clif Bar. While jerky contains 2081mg of sodium, clif Bar contains only 195mg. Jerky has a lower glycemic index. The glycemic index of jerky is 0, while the glycemic index of clif Bar is 57. These are the specific foods used in this comparison Snacks, beef jerky, chopped, and formed and Snacks, CLIF BAR, mixed flavors .
Infographic
Mineral Comparison
Mineral comparison score is based on the number of minerals by which one or the other food is richer. The "coverage" charts below show how much of the daily needs can be covered by 300 grams of the food.
3
100 g
300 g
1 piece, large - 20g 1 oz - 28.35g 1 oz - 28.35g
Magnesium
Magnesium
Calcium
Calcium
Potassium
Potassium
Iron
Iron
Copper
Copper
Zinc
Zinc
Phosphorus
Phosphorus
Sodium
Sodium
Manganese
Manganese
Selenium
Selenium
36%
6%
53%
203%
76%
221%
174%
271%
14%
58%
7
100 g
300 g
1 bar - 68g
Magnesium
Magnesium
Calcium
Calcium
Potassium
Potassium
Iron
Iron
Copper
Copper
Zinc
Zinc
Phosphorus
Phosphorus
Sodium
Sodium
Manganese
Manganese
Selenium
Selenium
105%
110%
36%
248%
147%
120%
126%
25%
280%
112%
Vitamin Comparison
Vitamin comparison score is based on the number of vitamins by which one or the other food is richer. The "coverage" charts below show how much of the daily needs can be covered by 300 grams of the food.
3
100 g
300 g
1 piece, large - 20g 1 oz - 28.35g 1 oz - 28.35g
Vitamin C
Vit. C
Vitamin D
Vit. D
Vitamin A
Vit. A
Vitamin E
Vit. E
Vitamin B1
Vit. B1
Vitamin B2
Vit. B2
Vitamin B3
Vit. B3
Vitamin B5
Vit. B5
Vitamin B6
Vit. B6
Vitamin B12
Vit. B12
Vitamin K
Vit. K
Folate
Folate
0%
4.5%
0%
9.8%
39%
33%
32%
9.8%
41%
124%
5.8%
101%
9
100 g
300 g
1 bar - 68g
Vitamin C
Vit. C
Vitamin D
Vit. D
Vitamin A
Vit. A
Vitamin E
Vit. E
Vitamin B1
Vit. B1
Vitamin B2
Vit. B2
Vitamin B3
Vit. B3
Vitamin B5
Vit. B5
Vitamin B6
Vit. B6
Vitamin B12
Vit. B12
Vitamin K
Vit. K
Folate
Folate
294%
0%
0.33%
4.8%
138%
87%
83%
132%
136%
165%
92%
89%
All nutrients comparison - raw data values
Nutrient
DV% diff.
Vitamin C
0mg
88.2mg
98%
Manganese
0.111mg
2.146mg
88%
Sodium
2081mg
195mg
82%
Saturated fat
10.85g
1.471g
43%
Vitamin B5
0.163mg
2.206mg
41%
Protein
33.2g
14.71g
37%
Calcium
20mg
368mg
35%
Zinc
8.11mg
4.41mg
34%
Vitamin B1
0.154mg
0.551mg
33%
Vitamin B6
0.179mg
0.588mg
31%
Fats
25.6g
5.88g
30%
Vitamin K
2.3µg
36.8µg
29%
Monounsaturated fat
11.305g
1.093g
26%
Copper
0.227mg
0.441mg
24%
Magnesium
51mg
147mg
23%
Fiber
1.8g
7.4g
22%
Carbs
11g
65.44g
18%
Selenium
10.7µg
20.6µg
18%
Vitamin B2
0.142mg
0.375mg
18%
Vitamin B3
1.732mg
4.412mg
17%
Cholesterol
48mg
0mg
16%
Phosphorus
407mg
294mg
16%
Iron
5.42mg
6.62mg
15%
Vitamin B12
0.99µg
1.32µg
14%
Choline
109.1mg
46.2mg
11%
Polyunsaturated fat
1.011g
2.182g
8%
Potassium
597mg
412mg
5%
Folate
134µg
118µg
4%
Calories
410kcal
346kcal
3%
Vitamin D
0.3µg
0µg
2%
Vitamin E
0.49mg
0.24mg
2%
Vitamin D*
11 IU
0 IU
1%
Protein per 100 calories
8.1g
4.3g
N/A
Calories per 10 g protein
123kcal
235kcal
N/A
Weight per 100 calories
24g
29g
N/A
Unsaturated / Saturated Fat ratio
1.1
2.2
N/A
Net carbs
9.2g
58.04g
N/A
Sugar
9g
31.62g
N/A
Vitamin A
0µg
1µg
0%
Macronutrient Comparison
Macronutrient breakdown side-by-side comparison
4
33%
26%
11%
23%
7%
Protein:
33.2 g
Fats:
25.6 g
Carbs:
11 g
Water:
23.36 g
Other:
6.84 g
1
15%
6%
65%
11%
3%
Protein:
14.71 g
Fats:
5.88 g
Carbs:
65.44 g
Water:
11 g
Other:
2.97 g
Contains
more
Protein Protein
+125.7%
Contains
more
Fats Fats
+335.4%
Contains
more
Water Water
+112.4%
Contains
more
Other Other
+130.3%
Contains
more
Carbs Carbs
+494.9%
Fat Type Comparison
Fat type breakdown side-by-side comparison
1
47%
49%
4%
Saturated fat:
Sat. Fat
10.85 g
Monounsaturated fat:
Mono. Fat
11.305 g
Polyunsaturated fat:
Poly. Fat
1.011 g
2
31%
23%
46%
Saturated fat:
Sat. Fat
1.471 g
Monounsaturated fat:
Mono. Fat
1.093 g
Polyunsaturated fat:
Poly. Fat
2.182 g
Contains
more
Mono. Fat Monounsaturated fat
+934.3%
Contains
less
Sat. Fat Saturated fat
-86.4%
Contains
more
Poly. Fat Polyunsaturated fat
+115.8%