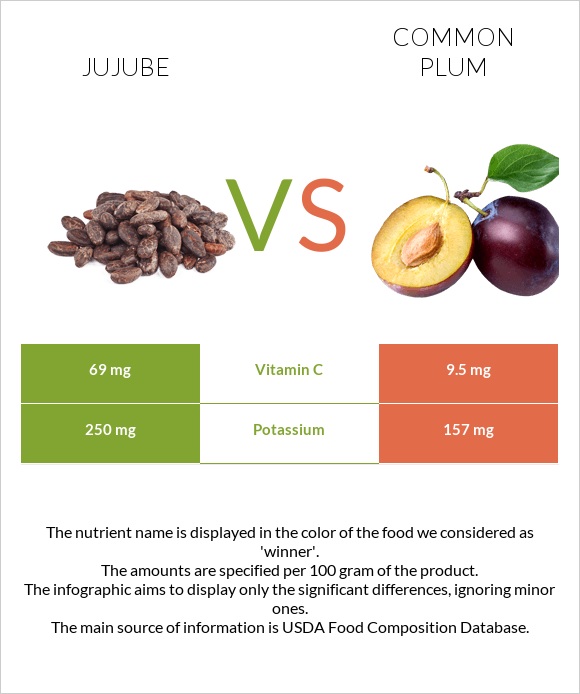
A recap on the differences between jujube and plums Jujube is higher in vitamin C, yet plums are higher in vitamin A. Jujube covers your daily vitamin C needs 66% more than plums. Jujube contains 2 times more potassium than plums. While jujube contains 250mg of potassium, plums contain only 157mg. The glycemic index of jujube is lower. Food varieties used in this article are Jujube, raw and Plums, raw .
Infographic
Mineral Comparison
Mineral comparison score is based on the number of minerals by which one or the other food is richer. The "coverage" charts below show how much of the daily needs can be covered by 300 grams of the food.
7
100 g
300 g
Magnesium
Magnesium
Calcium
Calcium
Potassium
Potassium
Iron
Iron
Copper
Copper
Zinc
Zinc
Phosphorus
Phosphorus
Sodium
Sodium
Manganese
Manganese
Selenium
Selenium
7.1%
6.3%
22%
18%
24%
1.4%
9.9%
0.39%
11%
0%
2
100 g
300 g
1 fruit (2-1/8" dia) - 66g 1 NLEA serving - 151g 1 cup, sliced - 165g
Magnesium
Magnesium
Calcium
Calcium
Potassium
Potassium
Iron
Iron
Copper
Copper
Zinc
Zinc
Phosphorus
Phosphorus
Sodium
Sodium
Manganese
Manganese
Selenium
Selenium
5%
1.8%
14%
6.4%
19%
2.7%
6.9%
0%
6.8%
0%
Vitamin Comparison
Vitamin comparison score is based on the number of vitamins by which one or the other food is richer. The "coverage" charts below show how much of the daily needs can be covered by 300 grams of the food.
4
100 g
300 g
Vitamin C
Vit. C
Vitamin D
Vit. D
Vitamin A
Vit. A
Vitamin E
Vit. E
Vitamin B1
Vit. B1
Vitamin B2
Vit. B2
Vitamin B3
Vit. B3
Vitamin B5
Vit. B5
Vitamin B6
Vit. B6
Vitamin B12
Vit. B12
Vitamin K
Vit. K
Folate
Folate
230%
0%
0.67%
0%
5%
9.2%
17%
0%
19%
0%
0%
0%
6
100 g
300 g
1 fruit (2-1/8" dia) - 66g 1 NLEA serving - 151g 1 cup, sliced - 165g
Vitamin C
Vit. C
Vitamin D
Vit. D
Vitamin A
Vit. A
Vitamin E
Vit. E
Vitamin B1
Vit. B1
Vitamin B2
Vit. B2
Vitamin B3
Vit. B3
Vitamin B5
Vit. B5
Vitamin B6
Vit. B6
Vitamin B12
Vit. B12
Vitamin K
Vit. K
Folate
Folate
32%
0%
5.7%
5.2%
7%
6%
7.8%
8.1%
6.7%
0%
16%
3.8%
All nutrients comparison - raw data values
Nutrient
DV% diff.
Vitamin C
69mg
9.5mg
66%
Fiber
1.4g
6%
Vitamin K
6.4µg
5%
Iron
0.48mg
0.17mg
4%
Vitamin B6
0.081mg
0.029mg
4%
Fructose
3.07g
4%
Carbs
20.23g
11.42g
3%
Potassium
250mg
157mg
3%
Vitamin B3
0.9mg
0.417mg
3%
Vitamin B5
0.135mg
3%
Calories
79kcal
46kcal
2%
Calcium
21mg
6mg
2%
Copper
0.073mg
0.057mg
2%
Vitamin A
2µg
17µg
2%
Vitamin E
0.26mg
2%
Protein
1.2g
0.7g
1%
Magnesium
10mg
7mg
1%
Phosphorus
23mg
16mg
1%
Manganese
0.084mg
0.052mg
1%
Vitamin B1
0.02mg
0.028mg
1%
Vitamin B2
0.04mg
0.026mg
1%
Folate
5µg
1%
Protein per 100 calories
1.5g
1.5g
N/A
Calories per 10 g protein
658kcal
657kcal
N/A
Weight per 100 calories
127g
217g
N/A
Fats
0.2g
0.28g
0%
Net carbs
20.23g
10.02g
N/A
Sugar
9.92g
N/A
Zinc
0.05mg
0.1mg
0%
Sodium
3mg
0mg
0%
Choline
1.9mg
0%
Saturated fat
0.017g
0%
Monounsaturated fat
0.134g
0%
Polyunsaturated fat
0.044g
0%
Tryptophan
0.009mg
0%
Threonine
0.01mg
0%
Isoleucine
0.014mg
0%
Leucine
0.015mg
0%
Lysine
0.016mg
0%
Methionine
0.008mg
0%
Phenylalanine
0.014mg
0%
Valine
0.016mg
0%
Histidine
0.009mg
0%
Macronutrient Comparison
Macronutrient breakdown side-by-side comparison
3
20%
78%
Protein:
1.2 g
Fats:
0.2 g
Carbs:
20.23 g
Water:
77.86 g
Other:
0.51 g
2
11%
87%
Protein:
0.7 g
Fats:
0.28 g
Carbs:
11.42 g
Water:
87.23 g
Other:
0.37 g
Contains
more
Protein Protein
+71.4%
Contains
more
Carbs Carbs
+77.1%
Contains
more
Other Other
+37.8%
Contains
more
Fats Fats
+40%
Contains
more
Water Water
+12%